See more : ToolGen Incorporated (199800.KQ) Income Statement Analysis – Financial Results
Complete financial analysis of Vertical Aerospace Ltd. (EVTL) income statement, including revenue, profit margins, EPS and key performance metrics. Get detailed insights into the financial performance of Vertical Aerospace Ltd., a leading company in the Aerospace & Defense industry within the Industrials sector.
- Xiamen XGMA Machinery Company Limited (600815.SS) Income Statement Analysis – Financial Results
- Reinvent Technology Partners (RTP) Income Statement Analysis – Financial Results
- Samyoung Electronics Co., Ltd (005680.KS) Income Statement Analysis – Financial Results
- Petro USA, Inc. (PBAJ) Income Statement Analysis – Financial Results
- Nippon Shinyaku Co., Ltd. (4516.T) Income Statement Analysis – Financial Results
Vertical Aerospace Ltd. (EVTL)
About Vertical Aerospace Ltd.
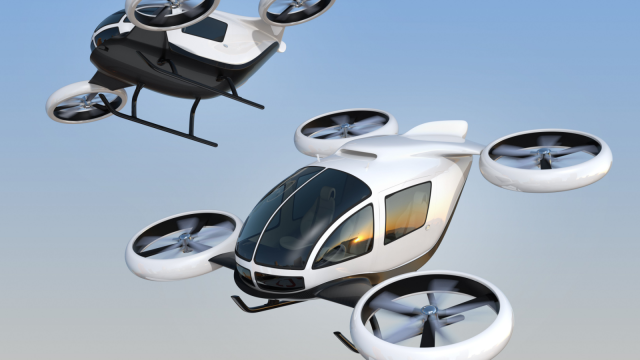
Vertical Aerospace Ltd. engages in designing, manufacturing, and selling electric aircraft. It offers VX4, an electric vertical take-off and landing vehicle. The company was founded in 2016 and is headquartered in Bristol, the United Kingdom.
| Metric | 2023 | 2022 | 2021 | 2020 | 2019 |
|---|---|---|---|---|---|
| Revenue | 0.00 | 0.00 | 132.00K | 87.00K | 70.00K |
| Cost of Revenue | 0.00 | 0.00 | 64.00K | 44.00K | 66.00K |
| Gross Profit | 0.00 | 0.00 | 68.00K | 43.00K | 4.00K |
| Gross Profit Ratio | 0.00% | 0.00% | 51.52% | 49.43% | 5.71% |
| Research & Development | 65.37M | 49.13M | 24.29M | 9.97M | 5.15M |
| General & Administrative | 38.34M | 54.89M | 264.37M | 3.90M | 2.70M |
| Selling & Marketing | 688.00K | 1.73M | 3.92M | 0.00 | 0.00 |
| SG&A | 40.90M | 54.89M | 264.37M | 3.90M | 2.70M |
| Other Expenses | -4.33M | -5.91M | -11.35M | -2.32M | -399.00K |
| Operating Expenses | 101.95M | 98.11M | 277.31M | 11.56M | 7.45M |
| Cost & Expenses | 101.95M | 98.11M | 277.37M | 11.60M | 7.52M |
| Interest Income | 13.00K | 623.00K | 560.00K | 783.00K | 46.00K |
| Interest Expense | 0.00 | 15.04M | 560.00K | 802.00K | 46.00K |
| Depreciation & Amortization | 892.00K | 577.00K | 942.00K | 682.00K | 330.00K |
| EBITDA | -101.06M | -96.06M | -243.71M | -10.86M | -7.14M |
| EBITDA Ratio | 0.00% | 0.00% | -209,307.58% | -12,457.47% | -10,175.71% |
| Operating Income | -101.95M | -98.11M | -277.24M | -11.52M | -7.45M |
| Operating Income Ratio | 0.00% | 0.00% | -210,029.55% | -13,235.63% | -10,640.00% |
| Total Other Income/Expenses | 19.34M | 3.73M | 32.02M | -807.00K | -66.00K |
| Income Before Tax | -82.61M | -94.38M | -245.22M | -12.32M | -7.51M |
| Income Before Tax Ratio | 0.00% | 0.00% | -185,775.76% | -14,163.22% | -10,734.29% |
| Income Tax Expense | 22.66M | -18.27M | 560.00K | 4.00K | -30.00K |
| Net Income | -59.95M | -76.11M | -245.78M | -12.33M | -7.48M |
| Net Income Ratio | 0.00% | 0.00% | -186,200.00% | -14,167.82% | -10,691.43% |
| EPS | -3.13 | -5.26 | -19.76 | -1.23 | -0.75 |
| EPS Diluted | -3.13 | -5.26 | -19.76 | -1.23 | -0.75 |
| Weighted Avg Shares Out | 19.13M | 17.95M | 12.41M | 9.99M | 9.99M |
| Weighted Avg Shares Out (Dil) | 19.13M | 17.95M | 12.41M | 9.99M | 9.99M |

Hot eVTOL Stocks: The 3 Best Opportunities for Investing in Flying Cars

Vertical Aerospace Announces Release of Shareholder Letter and Filing of Annual Report on Form 20-F

Investing at Mach Speed: 3 Flying Car Stocks for the Boldest Investors

7 of the Best Speculative Stocks You Can Snag for Less Than $1

3 Flying Car Stocks to Buy (That Aren't Joby Aviation)

Vertical Enters Into Investment Agreement With Founder and CEO, Stephen Fitzpatrick Committing to Provide up to $50 Million of Funding

3 Millionaire-Maker Flying Car Stocks to Buy in February 2024

3 E-VTOL stocks: Which ones can fly higher in 2024?

Vertical Wins New UK Government Backing to Transform the Future of Flight

3 Flying Car Stocks to Skip Despite the Strong Overall Outlook
Source: https://incomestatements.info
Category: Stock Reports
