See more : Svitzer Group A/S (SVITZR.ST) Income Statement Analysis – Financial Results
Complete financial analysis of Diamondback Energy, Inc. (FANG) income statement, including revenue, profit margins, EPS and key performance metrics. Get detailed insights into the financial performance of Diamondback Energy, Inc., a leading company in the Oil & Gas Exploration & Production industry within the Energy sector.
- Astrakhan Power Sale Company Public Joint-Stock Company (ASSB.ME) Income Statement Analysis – Financial Results
- CF Finance Acquisition Corp. III (CFACU) Income Statement Analysis – Financial Results
- Froch Enterprise Co., Ltd. (2030.TW) Income Statement Analysis – Financial Results
- Alteryx, Inc. (AYX) Income Statement Analysis – Financial Results
- Train Alliance Sweden AB (publ) (TRAIN-B.ST) Income Statement Analysis – Financial Results
Diamondback Energy, Inc. (FANG)
Industry: Oil & Gas Exploration & Production
Sector: Energy
Website: https://www.diamondbackenergy.com
About Diamondback Energy, Inc.
Diamondback Energy, Inc., an independent oil and natural gas company, focuses on the acquisition, development, exploration, and exploitation of unconventional and onshore oil and natural gas reserves in the Permian Basin in West Texas. It focuses on the development of the Spraberry and Wolfcamp formations of the Midland basin; and the Wolfcamp and Bone Spring formations of the Delaware basin, which are part of the Permian Basin in West Texas and New Mexico. As of December 31, 2021, the company's total acreage position was approximately 524,700 gross acres in the Permian Basin; and estimated proved oil and natural gas reserves were 1,788,991 thousand barrels of crude oil equivalent. It also held working interests in 5,289 gross producing wells, as well as royalty interests in 6,455 additional wells. In addition, the company owns mineral interests approximately 930,871 gross acres and 27,027 net royalty acres in the Permian Basin and Eagle Ford Shale; and owns, operates, develops, and acquires midstream infrastructure assets, including 866 miles of crude oil gathering pipelines, natural gas gathering pipelines, and an integrated water system in the Midland and Delaware Basins of the Permian Basin. Diamondback Energy, Inc. was founded in 2007 and is headquartered in Midland, Texas.
| Metric | 2023 | 2022 | 2021 | 2020 | 2019 | 2018 | 2017 | 2016 | 2015 | 2014 | 2013 | 2012 | 2011 | 2010 | 2009 |
|---|---|---|---|---|---|---|---|---|---|---|---|---|---|---|---|
| Revenue | 8.41B | 9.64B | 6.80B | 2.81B | 3.96B | 2.17B | 1.21B | 527.11M | 446.73M | 495.72M | 208.00M | 74.96M | 48.67M | 27.25M | 12.72M |
| Cost of Revenue | 3.54B | 2.87B | 2.57B | 2.17B | 2.36B | 1.06B | 550.03M | 306.51M | 339.40M | 261.32M | 101.57M | 47.18M | 4.27M | 2.26M | 705.16K |
| Gross Profit | 4.87B | 6.78B | 4.23B | 644.00M | 1.60B | 1.11B | 655.08M | 220.60M | 107.33M | 234.40M | 106.43M | 27.78M | 44.40M | 24.99M | 12.01M |
| Gross Profit Ratio | 57.91% | 70.29% | 62.25% | 22.89% | 40.36% | 51.14% | 54.36% | 41.85% | 24.03% | 47.29% | 51.17% | 37.06% | 91.23% | 91.69% | 94.45% |
| Research & Development | 0.00 | 0.00 | 0.00 | 0.00 | 0.00 | 0.00 | 0.00 | 0.00 | 0.00 | 0.00 | 0.00 | 0.00 | 0.00 | 0.00 | 0.00 |
| General & Administrative | 150.00M | 144.00M | 146.00M | 88.00M | 104.00M | 64.55M | 48.67M | 42.62M | 31.97M | 21.27M | 11.04M | 10.38M | 0.00 | 0.00 | 0.00 |
| Selling & Marketing | 0.00 | 0.00 | 0.00 | 0.00 | 0.00 | 0.00 | 0.00 | 0.00 | 0.00 | 0.00 | 0.00 | 0.00 | 0.00 | 0.00 | 0.00 |
| SG&A | 150.00M | 144.00M | 146.00M | 88.00M | 104.00M | 64.55M | 48.67M | 42.62M | 31.97M | 21.27M | 11.04M | 10.38M | 3.60M | 3.05M | 5.06M |
| Other Expenses | 151.00M | 112.00M | 6.00M | 11.00M | 11.00M | 89.00M | 10.24M | 3.06M | 728.00K | -739.00K | 1.08M | 2.13M | 29.41M | 15.82M | 10.67M |
| Operating Expenses | 290.00M | 256.00M | 152.00M | 99.00M | 115.00M | 60.67M | 50.06M | 43.68M | 32.80M | 21.73M | 11.24M | 10.47M | 29.41M | 15.82M | 10.67M |
| Cost & Expenses | 3.83B | 3.12B | 2.72B | 2.27B | 2.48B | 1.12B | 600.09M | 350.19M | 372.20M | 283.05M | 112.81M | 57.66M | 33.68M | 18.09M | 11.38M |
| Interest Income | 2.00M | 1.00M | 1.00M | 4.00M | 1.00M | 276.00K | 0.00 | 0.00 | 0.00 | 1.00K | 1.00K | 3.00K | 11.20K | 34.47K | 35.08K |
| Interest Expense | 177.00M | 159.00M | 199.00M | 197.00M | 172.00M | 87.28M | 40.55M | 40.68M | 41.51M | 34.51M | 8.06M | 3.61M | 2.53M | 836.27K | 10.94K |
| Depreciation & Amortization | 1.75B | 1.34B | 1.28B | 1.31B | 1.45B | 625.17M | 328.15M | 179.08M | 217.70M | 170.01M | 66.60M | 26.27M | 15.91M | 8.15M | 3.22M |
| EBITDA | 6.17B | 7.34B | 4.38B | -4.26B | 2.79B | 1.83B | 866.07M | 55.05M | -489.06M | 509.48M | 159.31M | 48.36M | 4.80M | 17.24M | 4.55M |
| EBITDA Ratio | 73.36% | 81.52% | 78.62% | 65.80% | 97.91% | 45.40% | 51.05% | 34.15% | 16.85% | 42.75% | 46.28% | 60.98% | 90.20% | 64.06% | 67.80% |
| Operating Income | 4.57B | 6.51B | 4.00B | 547.00M | 2.43B | 1.01B | 605.02M | -68.62M | -740.27M | 212.67M | 95.19M | 17.31M | 14.99M | 9.17M | 1.34M |
| Operating Income Ratio | 54.33% | 67.49% | 58.86% | 19.45% | 61.40% | 46.65% | 50.20% | -13.02% | -165.71% | 42.90% | 45.77% | 23.09% | 30.79% | 33.63% | 10.52% |
| Total Other Income/Expenses | -322.00M | -772.00M | -1.09B | -300.00M | -333.00M | 102.47M | -107.83M | -96.10M | -8.83M | 92.29M | -8.85M | 1.08M | -13.18M | -147.98K | -4.07M |
| Income Before Tax | 4.25B | 5.74B | 2.91B | -5.78B | 362.00M | 1.11B | 497.19M | -164.72M | -749.10M | 304.96M | 86.34M | 18.38M | 1.97M | 9.02M | -2.73M |
| Income Before Tax Ratio | 50.50% | 59.48% | 42.77% | -205.33% | 9.13% | 51.37% | 41.26% | -31.25% | -167.68% | 61.52% | 41.51% | 24.52% | 4.05% | 33.09% | -21.47% |
| Income Tax Expense | 912.00M | 1.17B | 631.00M | -1.10B | 47.00M | 168.36M | -19.57M | 192.00K | -201.31M | 108.99M | 31.75M | 6.55M | 15.53M | 949.77K | 4.04M |
| Net Income | 3.14B | 4.39B | 2.18B | -4.67B | 240.00M | 845.67M | 482.26M | -165.03M | -550.63M | 193.76M | 54.59M | 11.83M | -545.05K | 8.22M | -2.71M |
| Net Income Ratio | 37.36% | 45.48% | 32.10% | -166.09% | 6.05% | 39.03% | 40.02% | -31.31% | -123.26% | 39.09% | 26.24% | 15.78% | -1.12% | 30.15% | -21.28% |
| EPS | 17.34 | 24.61 | 12.35 | -29.57 | 1.47 | 8.08 | 4.95 | -2.20 | -8.74 | 3.67 | 1.30 | -0.99 | -0.02 | 0.36 | -0.12 |
| EPS Diluted | 17.34 | 24.61 | 12.30 | -29.57 | 1.46 | 8.06 | 4.94 | -2.20 | -8.74 | 3.64 | 1.29 | -0.99 | -0.02 | 0.36 | -0.12 |
| Weighted Avg Shares Out | 180.00M | 176.54M | 176.64M | 157.98M | 163.49M | 104.62M | 97.46M | 75.02M | 63.00M | 52.83M | 42.01M | 36.99M | 22.61M | 22.61M | 22.61M |
| Weighted Avg Shares Out (Dil) | 180.00M | 176.54M | 177.36M | 157.98M | 163.84M | 104.93M | 97.69M | 75.08M | 63.02M | 53.30M | 42.26M | 36.99M | 22.61M | 22.61M | 22.61M |
3 Cash-Cow Stocks Offering Unbeatable Income
Will Diamondback (FANG) Beat Estimates Again in Its Next Earnings Report?
3 Stocks to Buy if the S&P 500 Retraces Its Gains to October Lows

Energy Stocks: Winners And Losers At The Beginning Of H2 2024

Why the Market Dipped But Diamondback Energy (FANG) Gained Today
While The Tech Sector Corrects, Energy Quietly Rises: 5 Stocks For Your Watch List
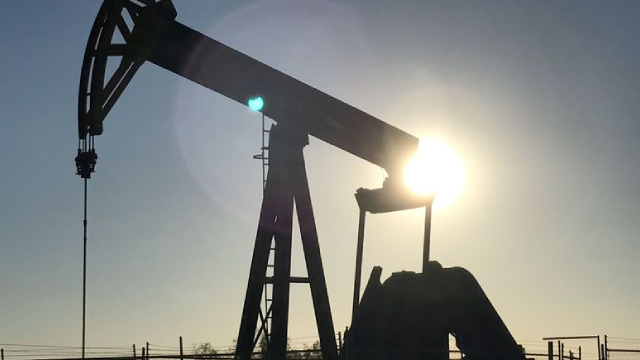
The 3 Smartest Oil & Gas Stocks to Buy With $500 Right Now

3 Permian Stocks to Keep on Your Radar on Strong Oil Prices
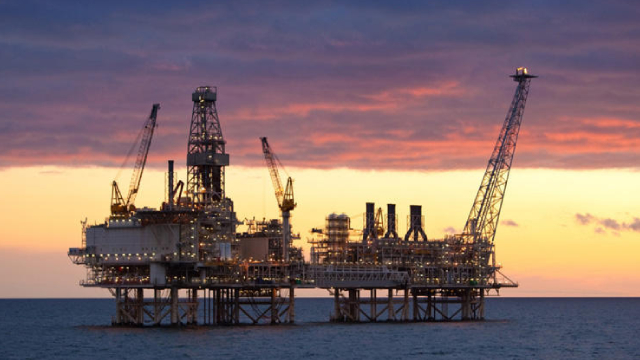
4 Oil Companies Capitalizing on Booming Permian Production

Diamondback Energy, Inc. Schedules Second Quarter 2024 Conference Call for August 6, 2024
Source: https://incomestatements.info
Category: Stock Reports
