See more : Taiwan Green Environment Technology Inc. (5205.TWO) Income Statement Analysis – Financial Results
Complete financial analysis of 5E Advanced Materials Inc. (FEAM) income statement, including revenue, profit margins, EPS and key performance metrics. Get detailed insights into the financial performance of 5E Advanced Materials Inc., a leading company in the Chemicals – Specialty industry within the Basic Materials sector.
- BioMaxima S.A. (BMX.WA) Income Statement Analysis – Financial Results
- Altra Industrial Motion Corp. (AIMC) Income Statement Analysis – Financial Results
- Nearmap Ltd (NEA.AX) Income Statement Analysis – Financial Results
- ING Groep N.V. (INGVF) Income Statement Analysis – Financial Results
- BMEX Gold Inc. (MRIRF) Income Statement Analysis – Financial Results
5E Advanced Materials Inc. (FEAM)
About 5E Advanced Materials Inc.
5E Advanced Materials Inc. engages in the exploration and development of mineral properties in Australia and the United States. The company primarily explores for borates and lithium deposits. It focuses on the Fort Cady project located in Southern California. The company was formerly known as American Pacific Borates Limited. 5E Advanced Materials Inc. was incorporated in 2016 and is headquartered in Houston, Texas.
| Metric | 2024 | 2023 | 2022 | 2021 | 2020 | 2019 | 2018 | 2017 |
|---|---|---|---|---|---|---|---|---|
| Revenue | 0.00 | 0.00 | 0.00 | 0.00 | 135.85K | 78.74K | 0.00 | 0.00 |
| Cost of Revenue | 6.63M | 371.00K | 246.00K | 5.97K | 18.82K | 10.10K | 4.54K | 0.00 |
| Gross Profit | -6.63M | -371.00K | -246.00K | -5.97K | 117.03K | 68.65K | -4.54K | 0.00 |
| Gross Profit Ratio | 0.00% | 0.00% | 0.00% | 0.00% | 86.15% | 87.18% | 0.00% | 0.00% |
| Research & Development | 45.00K | 262.00K | 133.00K | 0.00 | 0.00 | 0.00 | 0.00 | 0.00 |
| General & Administrative | 24.01M | 25.37M | 54.73M | 11.64M | 1.72M | 1.59M | 1.41M | 622.82K |
| Selling & Marketing | 0.00 | 0.00 | 0.00 | 0.00 | 100.48K | 182.84K | 239.31K | 18.23K |
| SG&A | 24.01M | 25.37M | 54.73M | 11.64M | 3.04M | 2.25M | 2.36M | 641.05K |
| Other Expenses | 5.17M | 47.00K | 12.97M | 6.00M | 0.00 | 0.00 | 0.00 | 0.00 |
| Operating Expenses | 29.23M | 35.80M | 67.83M | 17.63M | 3.04M | 2.25M | 2.36M | 641.05K |
| Cost & Expenses | 35.86M | 35.80M | 67.83M | 17.63M | 3.06M | 2.26M | 2.36M | 641.05K |
| Interest Income | 0.00 | 1.15M | 3.00K | 9.00K | 7.69K | 7.35K | 6.76K | 1.75K |
| Interest Expense | 5.95M | 6.85M | 6.00K | 5.00K | 460.17K | 0.00 | 0.00 | 0.00 |
| Depreciation & Amortization | 5.17M | 371.00K | 246.00K | 31.00K | 18.82K | 10.10K | 4.54K | 979.98K |
| EBITDA | -30.69M | -34.26M | -66.46M | -17.55M | -3.00M | -2.15M | -2.17M | -0.94 |
| EBITDA Ratio | 0.00% | 0.00% | 0.00% | 0.00% | -2,239.94% | -2,858.91% | 0.00% | 0.00% |
| Operating Income | -35.86M | -36.71M | -67.83M | -17.63M | -3.06M | -2.26M | -2.36M | -641.05K |
| Operating Income Ratio | 0.00% | 0.00% | 0.00% | 0.00% | -2,253.80% | -2,871.73% | 0.00% | 0.00% |
| Total Other Income/Expenses | -26.15M | 6.08M | 1.12M | -1.62M | -708.73K | 101.25K | 189.90K | 1.14K |
| Income Before Tax | -62.01M | -30.62M | -66.71M | -19.25M | -3.48M | -2.16M | -2.17M | -639.91K |
| Income Before Tax Ratio | 0.00% | 0.00% | 0.00% | 0.00% | -2,561.76% | -2,743.14% | 0.00% | 0.00% |
| Income Tax Expense | 0.00 | 6.90M | -1.12M | 50.00K | 1.00 | 2.00 | -0.01 | -979.98K |
| Net Income | -62.01M | -30.62M | -66.71M | -19.25M | -3.48M | -2.16M | -2.17M | -639.91K |
| Net Income Ratio | 0.00% | 0.00% | 0.00% | 0.00% | -2,561.76% | -2,743.14% | 0.00% | 0.00% |
| EPS | -1.18 | -0.70 | -1.63 | -0.45 | -0.02 | -0.01 | -0.01 | -0.02 |
| EPS Diluted | -1.18 | -0.70 | -1.63 | -0.45 | -0.02 | -0.01 | -0.01 | -0.02 |
| Weighted Avg Shares Out | 52.52M | 43.84M | 40.81M | 42.52M | 221.87M | 190.79M | 164.63M | 28.25M |
| Weighted Avg Shares Out (Dil) | 52.52M | 43.84M | 40.81M | 42.52M | 222.10M | 190.78M | 164.62M | 28.25M |

5E Announces Date for Third Quarter 2022 Financial Results
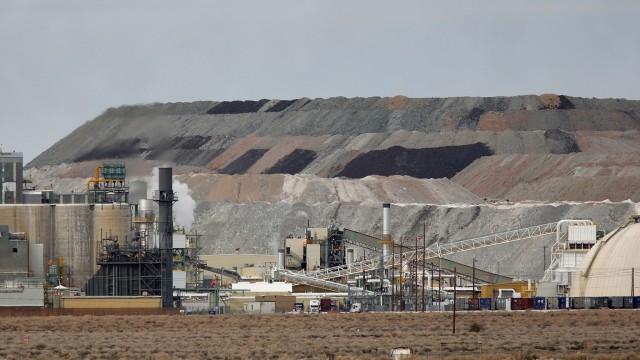
5E Advanced Materials: The Best Way To Play An Emerging Market
Boron: The Overlooked Critical Material

Outlook on the Cable Glands Global Market to 2027 - Featuring 3M, ABB & Addtech Among Others - ResearchAndMarkets.com

Worldwide Electrical Explosion Proof Equipment Industry to 2027 - Featuring Atex System, BARTEC Feam & Eaton Corporation Among Others - ResearchAndMarkets.com

Global Cable Glands Market Analysis & Industry Forecast 2017-2023, With an Expected CAGR of 6.1% - ResearchAndMarkets.com

Elizabeth Corley Elected to Morgan Stanley Board of Directors

Global Cable Glands Market Report 2016-2021 - Analysis, Technologies & Forecasts - Key Vendors: Caledonian Cables, CMP Products, BARTEC - Research and Markets

Research and Markets: Global Explosion Proof Equipment in Automation and Control Systems (Control Panels, Enclosures, Lighting, VFD, Material Handling Systems) Market 2015-2020
Source: https://incomestatements.info
Category: Stock Reports

