See more : Hitachi Construction Machinery Co., Ltd. (6305.T) Income Statement Analysis – Financial Results
Complete financial analysis of First Hydrogen Corp. (FHYDF) income statement, including revenue, profit margins, EPS and key performance metrics. Get detailed insights into the financial performance of First Hydrogen Corp., a leading company in the Auto – Manufacturers industry within the Consumer Cyclical sector.
- BNY Mellon Alcentra Global Credit Income 2024 Target Term Fund, Inc. (DCF) Income Statement Analysis – Financial Results
- Zhejiang Jinghua Laser Technology Co.,Ltd (603607.SS) Income Statement Analysis – Financial Results
- NOCIL Limited (NOCIL.NS) Income Statement Analysis – Financial Results
- PT Wahana Interfood Nusantara Tbk (COCO.JK) Income Statement Analysis – Financial Results
- China New Town Development Company Limited (1278.HK) Income Statement Analysis – Financial Results
First Hydrogen Corp. (FHYDF)
About First Hydrogen Corp.
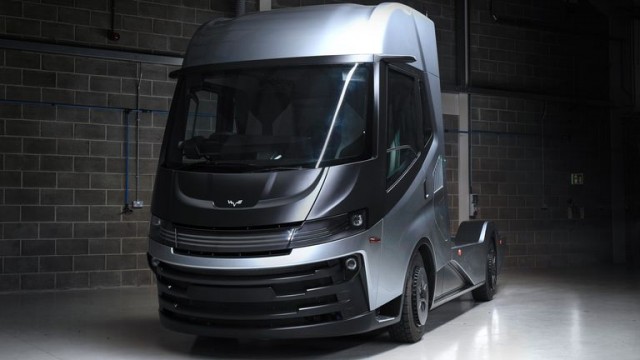
First Hydrogen Corp. focuses on zero-emission vehicles, green hydrogen production and distribution, and supercritical carbon dioxide extractor systems. It is designing and building hydrogen-fuel-cell-powered light and medium commercial vehicle under two agreements with AVL Powertrain and Ballard Power Systems Inc. The company was formerly known as Pure Extraction Corp. and changed its name to First Hydrogen Corp. in October 2021. First Hydrogen Corp. was incorporated in 2007 and is based in Vancouver, Canada.
| Metric | 2024 | 2023 | 2022 | 2021 | 2020 | 2019 | 2018 | 2017 | 2016 | 2015 | 2014 | 2013 |
|---|---|---|---|---|---|---|---|---|---|---|---|---|
| Revenue | 0.00 | 160.06K | 0.00 | 302.11K | 0.00 | 0.00 | 0.00 | 0.00 | 0.00 | 0.00 | 0.00 | 0.00 |
| Cost of Revenue | 117.36K | 6.74M | 0.00 | 697.58K | 0.00 | 0.00 | 0.00 | 0.00 | 0.00 | 0.00 | 0.00 | 0.00 |
| Gross Profit | -117.36K | -6.58M | 0.00 | -395.47K | 0.00 | 0.00 | 0.00 | 0.00 | 0.00 | 0.00 | 0.00 | 0.00 |
| Gross Profit Ratio | 0.00% | -4,113.11% | 0.00% | -130.90% | 0.00% | 0.00% | 0.00% | 0.00% | 0.00% | 0.00% | 0.00% | 0.00% |
| Research & Development | 1.03M | 5.10M | 4.54M | 33.45K | 0.00 | 0.00 | 0.00 | 0.00 | 0.00 | 0.00 | 0.00 | 0.00 |
| General & Administrative | 1.58M | 7.57M | 2.40M | 2.24M | 287.35K | 56.85K | 44.28K | 44.93K | 60.93K | 45.75K | 35.97K | 37.00K |
| Selling & Marketing | 2.60M | 2.72M | 1.46M | 9.32K | 2.19K | 0.00 | 20.24K | 13.88K | 5.67K | 0.00 | 0.00 | 0.00 |
| SG&A | 9.64M | 4.05M | 3.93M | 2.05M | 289.54K | 56.85K | 64.52K | 58.81K | 66.60K | 45.75K | 35.97K | 37.00K |
| Other Expenses | 0.00 | -13.42K | 0.00 | 0.00 | 0.00 | 8.71K | -29.48K | 0.00 | 0.00 | 0.00 | 0.00 | 0.00 |
| Operating Expenses | 10.67M | 9.17M | 8.47M | 2.08M | 289.54K | 56.85K | 94.00K | 58.81K | 66.60K | 54.96K | 47.71K | 47.88K |
| Cost & Expenses | 10.67M | 15.91M | 8.47M | 2.78M | 289.54K | 56.85K | 94.00K | 58.81K | 66.60K | 54.96K | 47.71K | 47.88K |
| Interest Income | 0.00 | 0.00 | 0.00 | 0.00 | 0.00 | 0.00 | 0.00 | 0.00 | 0.00 | 0.00 | 0.00 | 0.00 |
| Interest Expense | 165.84K | 184.81K | 413.06K | 3.55K | 0.00 | 0.00 | 0.00 | 0.00 | 23.00 | 0.00 | 0.00 | 0.00 |
| Depreciation & Amortization | 117.36K | 103.02K | 8.47M | 23.27K | 289.54K | 35.13K | 44.28K | 44.93K | 60.93K | 45.75K | 35.97K | 37.00K |
| EBITDA | -10.67M | -13.40M | 0.00 | -2.43M | 0.00 | 0.00 | 0.00 | 0.00 | 0.00 | 0.00 | 0.00 | -10.88K |
| EBITDA Ratio | 0.00% | -9,775.45% | 0.00% | -811.36% | 0.00% | 0.00% | 0.00% | 0.00% | 0.00% | 0.00% | 0.00% | 0.00% |
| Operating Income | -10.67M | -15.75M | -8.47M | -2.47M | -289.54K | -56.85K | -94.00K | -58.81K | -66.60K | -45.75K | -35.97K | -37.00K |
| Operating Income Ratio | 0.00% | -9,839.82% | 0.00% | -819.06% | 0.00% | 0.00% | 0.00% | 0.00% | 0.00% | 0.00% | 0.00% | 0.00% |
| Total Other Income/Expenses | -68.14K | 1.80M | -397.06K | -1.49M | -307.51K | -52.14K | -49.72K | 14.41K | -23.00 | -9.21K | -11.74K | -10.88K |
| Income Before Tax | -10.74M | -13.72M | -8.87M | -2.46M | -597.05K | -87.26K | -94.00K | -44.40K | -66.62K | -54.96K | -47.71K | -47.88K |
| Income Before Tax Ratio | 0.00% | -8,569.10% | 0.00% | -814.61% | 0.00% | 0.00% | 0.00% | 0.00% | 0.00% | 0.00% | 0.00% | 0.00% |
| Income Tax Expense | 0.00 | -1.00 | -8.47M | -5.00 | -289.54K | -171.86K | -44.28K | -44.93K | -60.93K | -9.21K | -11.74K | -10.88K |
| Net Income | -10.91M | -13.72M | -8.87M | -2.46M | -597.05K | -87.26K | -94.00K | -44.40K | -66.62K | -54.96K | -47.71K | -47.88K |
| Net Income Ratio | 0.00% | -8,569.10% | 0.00% | -814.61% | 0.00% | 0.00% | 0.00% | 0.00% | 0.00% | 0.00% | 0.00% | 0.00% |
| EPS | -0.15 | -0.23 | -0.18 | -0.06 | -0.04 | -0.01 | -0.03 | -0.03 | -0.05 | -0.07 | -0.06 | -0.06 |
| EPS Diluted | -0.15 | -0.23 | -0.18 | -0.06 | -0.04 | -0.01 | -0.03 | -0.03 | -0.05 | -0.07 | -0.06 | -0.06 |
| Weighted Avg Shares Out | 71.46M | 60.83M | 49.55M | 38.10M | 15.17M | 12.62M | 2.93M | 1.32M | 1.32M | 789.75K | 789.76K | 789.75K |
| Weighted Avg Shares Out (Dil) | 70.32M | 60.83M | 49.55M | 38.10M | 15.17M | 12.62M | 2.93M | 1.32M | 1.32M | 789.75K | 789.75K | 789.75K |

RETRANSMISSION: First Hydrogen Engages Sacre-Davey for Green Hydrogen Production Facility and Hydrogen Vehicle Assembly Factory

First Hydrogen Engages Sacre-Davey for Green Hydrogen Production Facility and Hydrogen Vehicle Assembly Factory

Hydrogen continues to be a game changer for platinum as Alberta looks to develop Canada's first hydrogen-powered community

World's first hydrogen self-driving HGV to be trialled by Asda

Ballard Power to fuel cell engines from Stadler Rail to power the U.S.'s first hydrogen train

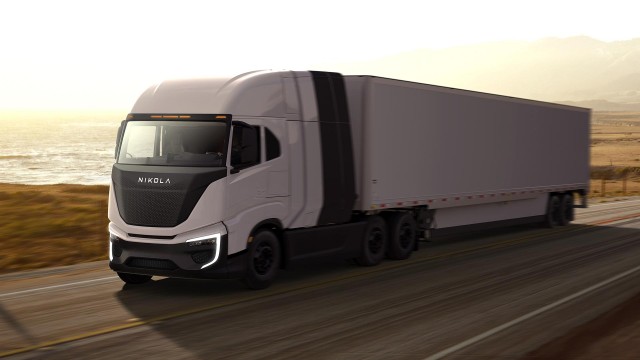
Nikola Shifting To Electric Semi Production, Building First Hydrogen Fuel Plant
Source: https://incomestatements.info
Category: Stock Reports
