See more : Emmaus Life Sciences, Inc. (EMMAW) Income Statement Analysis – Financial Results
Complete financial analysis of Empire State Realty OP, L.P. (FISK) income statement, including revenue, profit margins, EPS and key performance metrics. Get detailed insights into the financial performance of Empire State Realty OP, L.P., a leading company in the REIT – Office industry within the Real Estate sector.
- AVE S.A. (AVE.AT) Income Statement Analysis – Financial Results
- Cascadia Blockchain Group Corp. (CK.CN) Income Statement Analysis – Financial Results
- Kromek Group plc (KMK.L) Income Statement Analysis – Financial Results
- Getinge AB (publ) (GNGBY) Income Statement Analysis – Financial Results
- Shengshi Elevator International Holding Group Inc. (SSDT) Income Statement Analysis – Financial Results
Empire State Realty OP, L.P. (FISK)
About Empire State Realty OP, L.P.
Empire State Realty OP, L.P. operates as a subsidiary of Empire State Realty Trust, Inc.
| Metric | 2023 | 2022 | 2021 | 2020 | 2019 | 2018 | 2017 | 2016 | 2015 | 2014 | 2013 | 2012 | 2011 | 2010 | 2009 | 2008 |
|---|---|---|---|---|---|---|---|---|---|---|---|---|---|---|---|---|
| Revenue | 739.57M | 727.04M | 624.09M | 609.23M | 731.34M | 731.51M | 712.47M | 678.00M | 657.63M | 635.33M | 311.85M | 260.29M | 294.79M | 246.55M | 232.32M | 268.80M |
| Cost of Revenue | 339.02M | 321.35M | 279.49M | 291.11M | 333.99M | 319.47M | 305.60M | 289.07M | 296.53M | 306.16M | 145.44M | 105.71M | 86.26M | 87.94M | 87.79M | 80.15M |
| Gross Profit | 400.56M | 405.69M | 344.61M | 318.12M | 397.36M | 412.04M | 406.87M | 388.93M | 361.11M | 329.17M | 166.41M | 154.59M | 208.53M | 158.60M | 144.53M | 188.64M |
| Gross Profit Ratio | 54.16% | 55.80% | 55.22% | 52.22% | 54.33% | 56.33% | 57.11% | 57.36% | 54.91% | 51.81% | 53.36% | 59.39% | 70.74% | 64.33% | 62.21% | 70.18% |
| Research & Development | 0.00 | 0.09 | -0.02 | -0.05 | 0.12 | 0.17 | 0.18 | 0.17 | 0.00 | 0.00 | 0.00 | 0.00 | 0.00 | 0.00 | 0.00 | 0.00 |
| General & Administrative | 63.94M | 61.77M | 55.95M | 62.24M | 61.06M | 52.67M | 50.32M | 49.08M | 38.07M | 39.04M | 42.57M | 23.21M | 0.00 | 0.00 | 0.00 | 0.00 |
| Selling & Marketing | 0.00 | 0.00 | 0.00 | 0.00 | 0.00 | 0.00 | 0.00 | 0.00 | 0.00 | 0.00 | 0.00 | 1.30M | 0.00 | 0.00 | 0.00 | 0.00 |
| SG&A | 63.94M | 61.77M | 55.95M | 62.24M | 61.06M | 52.67M | 50.32M | 49.08M | 38.07M | 39.04M | 42.57M | 23.21M | 61.92M | 41.51M | 33.43M | 73.84M |
| Other Expenses | 0.00 | 216.89M | 201.81M | 191.01M | 181.59M | 168.51M | 160.71M | 155.21M | 171.47M | 145.43M | 65.41M | 42.69M | 97.43M | 75.55M | 62.75M | 100.68M |
| Operating Expenses | 253.85M | 278.66M | 257.75M | 253.25M | 242.65M | 221.18M | 211.03M | 204.29M | 209.55M | 184.47M | 107.97M | 65.90M | 97.43M | 75.55M | 62.75M | 100.68M |
| Cost & Expenses | 592.87M | 600.01M | 537.24M | 544.36M | 576.64M | 540.65M | 516.62M | 493.36M | 506.07M | 490.62M | 253.41M | 171.61M | 183.69M | 163.49M | 150.54M | 180.84M |
| Interest Income | 15.14M | 4.95M | 704.00K | 2.64M | 11.26M | 10.66M | 2.94M | 647.00K | 0.00 | 0.00 | 0.00 | 0.00 | 0.00 | 0.00 | 0.00 | 0.00 |
| Interest Expense | 101.48M | 101.21M | 94.39M | 89.91M | 79.25M | 79.62M | 68.47M | 71.15M | 67.49M | 66.46M | 56.96M | 54.39M | 54.75M | 52.26M | 50.74M | 48.66M |
| Depreciation & Amortization | 189.91M | 600.01M | 537.24M | 551.96M | 587.54M | 552.75M | 533.72M | 518.06M | 171.47M | 145.43M | 70.96M | 47.57M | 38.76M | 36.03M | 30.86M | 28.16M |
| EBITDA | 336.62M | 343.92M | 288.66M | 251.05M | 355.38M | 359.37M | 331.62M | 313.94M | 323.04M | 286.75M | 142.05M | 131.38M | 149.86M | 116.29M | 112.64M | 116.12M |
| EBITDA Ratio | 45.52% | 47.98% | 46.37% | 42.43% | 47.52% | 50.58% | 50.05% | 50.13% | 49.12% | 45.67% | 105.38% | 57.86% | 50.83% | 48.30% | 48.48% | 43.20% |
| Operating Income | 146.71M | 127.03M | 79.13M | 58.66M | 154.71M | 190.86M | 195.85M | 184.54M | 151.37M | 141.32M | 58.44M | 88.69M | 111.10M | 83.06M | 81.78M | 87.96M |
| Operating Income Ratio | 19.84% | 17.47% | 12.68% | 9.63% | 21.15% | 26.09% | 27.49% | 27.22% | 23.02% | 22.24% | 18.74% | 34.07% | 37.69% | 33.69% | 35.20% | 32.72% |
| Total Other Income/Expenses | -59.58M | -62.27M | -93.90M | -88.52M | -67.99M | -68.96M | -70.92M | -70.50M | -67.49M | -66.46M | 218.63M | -40.05M | -51.90M | -36.94M | -50.74M | -48.66M |
| Income Before Tax | 87.12M | 64.76M | -14.77M | -29.86M | 86.72M | 121.90M | 124.93M | 113.40M | 83.88M | 74.87M | 200.71M | 48.64M | 56.35M | 30.79M | 31.04M | 39.30M |
| Income Before Tax Ratio | 11.78% | 8.91% | -2.37% | -4.90% | 11.86% | 16.66% | 17.53% | 16.73% | 12.75% | 11.78% | 64.36% | 18.69% | 19.12% | 12.49% | 13.36% | 14.62% |
| Income Tax Expense | 2.72M | 1.55M | -1.73M | -6.97M | 2.43M | 4.64M | 6.67M | 6.15M | 3.95M | 4.66M | 374.39M | 68.74M | -3.89M | -15.32M | -10.80M | -13.42M |
| Net Income | 53.25M | 63.21M | -13.04M | -22.89M | 84.29M | 66.54M | 63.58M | 52.39M | 34.67M | 27.14M | 82.53M | 48.64M | 60.24M | 46.12M | 41.84M | 52.72M |
| Net Income Ratio | 7.20% | 8.69% | -2.09% | -3.76% | 11.53% | 9.10% | 8.92% | 7.73% | 5.27% | 4.27% | 26.46% | 18.69% | 20.44% | 18.71% | 18.01% | 19.61% |
| EPS | 0.50 | 0.38 | -0.08 | -0.13 | 0.47 | 0.38 | 0.40 | 0.38 | 0.30 | 0.27 | 0.79 | 0.53 | 0.66 | 0.49 | 0.46 | 0.58 |
| EPS Diluted | 0.30 | 0.23 | -0.05 | -0.08 | 0.29 | 0.22 | 0.39 | 0.38 | 0.29 | 0.27 | 0.79 | 0.53 | 0.66 | 0.49 | 0.46 | 0.58 |
| Weighted Avg Shares Out | 161.12M | 165.04M | 172.45M | 175.17M | 178.34M | 173.84M | 158.38M | 133.88M | 114.25M | 97.94M | 95.46M | 91.66M | 91.66M | 91.66M | 91.66M | 91.66M |
| Weighted Avg Shares Out (Dil) | 265.63M | 269.95M | 274.98M | 278.18M | 294.75M | 297.26M | 298.05M | 277.57M | 266.62M | 254.51M | 95.61M | 91.66M | 91.66M | 91.66M | 91.66M | 91.66M |

CVS/Aetna to waive cost sharing for coronavirus-related inpatient care

New York's coronavirus battle will have lessons for the U.S.

The coronavirus crisis is the moment Andrew Cuomo has prepared for all his life

When A Bull Turns Bear – Stocks May Still Fall 20% Further

ECB's Bazooka Support Bonds but not the Euro

3 Breathtaking Scenic Drives in New York

Total Pukefest: Futures Soar Limit Up, Crash, Then Soar Again

Dr. Birx on call to use military in coronavirus response: 'We are looking at every single possible solution'

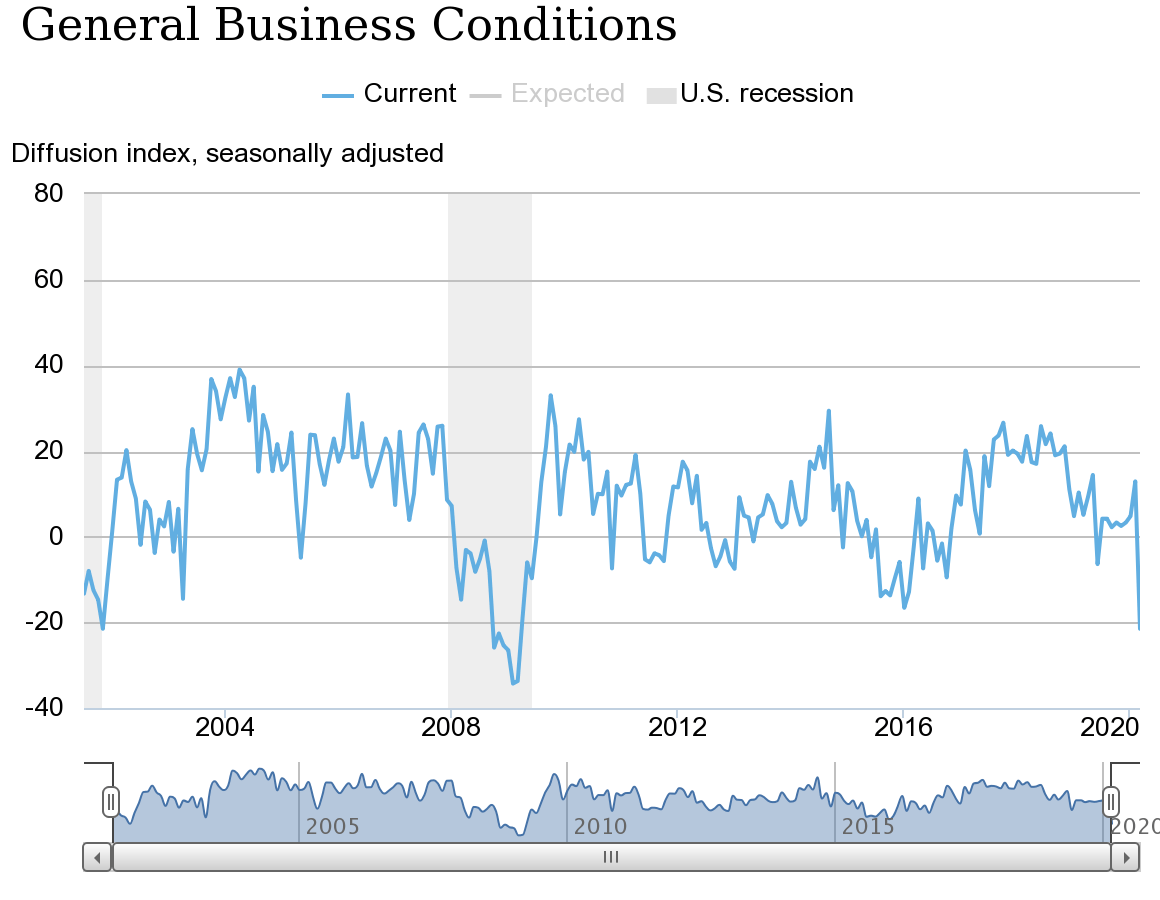
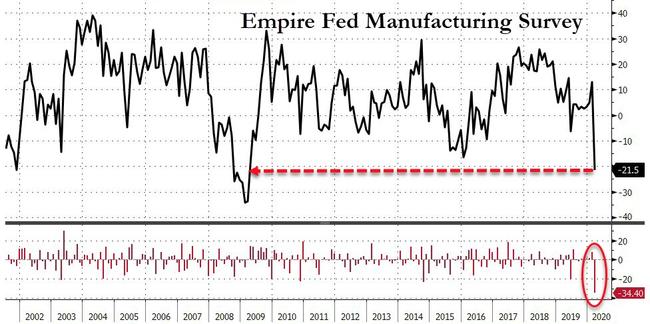
Empire State manufacturing index sees record decline to -21.5 in March

Empire Fed Survey Crashes By Most Ever To 11-Year-Lows
Source: https://incomestatements.info
Category: Stock Reports
