See more : Chow Steel Industries Public Company Limited (CHOW.BK) Income Statement Analysis – Financial Results
Complete financial analysis of Standard BioTools Inc. (FLDM) income statement, including revenue, profit margins, EPS and key performance metrics. Get detailed insights into the financial performance of Standard BioTools Inc., a leading company in the Medical – Diagnostics & Research industry within the Healthcare sector.
- CHS Inc. (CHSCP) Income Statement Analysis – Financial Results
- HeidelbergCement AG (HEI.DE) Income Statement Analysis – Financial Results
- Jiangxi Copper Company Limited (0358.HK) Income Statement Analysis – Financial Results
- ENEA S.A. (ENA.WA) Income Statement Analysis – Financial Results
- MBB SE (MBB.DE) Income Statement Analysis – Financial Results
Standard BioTools Inc. (FLDM)
About Standard BioTools Inc.
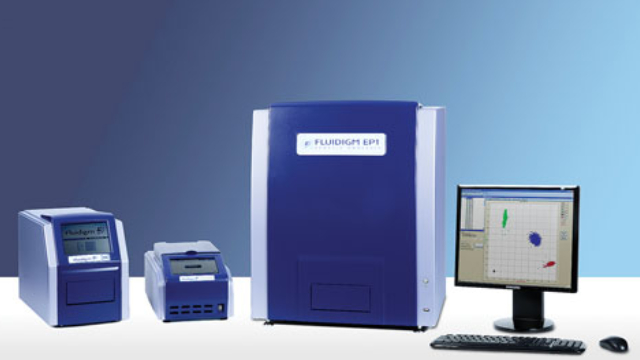
Fluidigm Corporation creates, manufactures, and markets instruments, consumables, reagents, and software for researchers and clinical laboratories worldwide. It offers analytical systems, such as Helios, a CyTOF system, as well as Hyperion imaging systems, Hyperion tissue imagers, and flow conductors; and assays and reagents, including Maxpar reagents, Maxpar direct immune profiling assays, Maxpar on demand reagents, and IMC panel kits for immuno-oncology. The company also provides preparatory instruments, such as Juno systems; and analytical instruments comprising Biomark HD system and EP1 system. In addition, it offers integrated fluidic circuits (IFCs), such as library preparation IFCs, Juno genotyping IFC, dynamic array IFCs, digital array IFCs, and Flex Six IFC; and assays and reagents, including Advanta RNA-Seq NGS library prep kits, Advanta Dx SARS-CoV-2 RT-PCR assays, Advanta Dx COVID-19 EASE assays, delta gene and SNP type assays, access array target-specific primers and targeted sequencing prep primers, and targeted DNA Seq library assays. Further, the company offers single cell microfluidics that comprise C1 systems; preparatory analytical instruments, which include C1 IFCs; and software solutions. It sells its products to academic research institutions; translational research and medicine centers; cancer centers; clinical research laboratories; biopharmaceutical, biotechnology, and plant and animal research companies; and contract research organizations. Fluidigm Corporation has license agreements with California Institute of Technology, Harvard University, and Caliper Life Sciences, Inc. The company was formerly known as Mycometrix Corporation and changed its name to Fluidigm Corporation in April 2001. Fluidigm Corporation was incorporated in 1999 and is headquartered in South San Francisco, California.
| Metric | 2023 | 2022 | 2021 | 2020 | 2019 | 2018 | 2017 | 2016 | 2015 | 2014 | 2013 | 2012 | 2011 | 2010 | 2009 | 2008 | 2007 | 2006 | 2001 |
|---|---|---|---|---|---|---|---|---|---|---|---|---|---|---|---|---|---|---|---|
| Revenue | 106.34M | 97.95M | 130.58M | 138.14M | 117.24M | 112.96M | 101.94M | 104.45M | 114.71M | 116.46M | 71.18M | 52.33M | 42.87M | 33.56M | 25.41M | 15.35M | 7.28M | 6.40M | 130.58M |
| Cost of Revenue | 55.89M | 60.90M | 61.21M | 54.82M | 52.96M | 51.32M | 49.96M | 46.01M | 46.63M | 42.85M | 20.08M | 15.33M | 13.19M | 11.58M | 11.49M | 8.36M | 3.51M | 2.77M | 53.32M |
| Gross Profit | 50.45M | 37.05M | 69.37M | 83.33M | 64.28M | 61.65M | 51.98M | 58.44M | 68.08M | 73.61M | 51.10M | 37.01M | 29.67M | 21.98M | 13.93M | 6.98M | 3.76M | 3.63M | 77.27M |
| Gross Profit Ratio | 47.44% | 37.83% | 53.13% | 60.32% | 54.83% | 54.57% | 50.99% | 55.95% | 59.35% | 63.21% | 71.79% | 70.72% | 69.23% | 65.49% | 54.80% | 45.50% | 51.70% | 56.66% | 59.17% |
| Research & Development | 25.95M | 38.50M | 37.94M | 36.46M | 31.64M | 30.03M | 30.83M | 38.42M | 39.26M | 43.42M | 19.73M | 16.60M | 13.94M | 13.01M | 12.32M | 14.02M | 14.39M | 15.59M | 37.94M |
| General & Administrative | 0.00 | 0.00 | 0.00 | 0.00 | 0.00 | 0.00 | 0.00 | 0.00 | 0.00 | 0.00 | 0.00 | 0.00 | 0.00 | 0.00 | 0.00 | 0.00 | 0.00 | 0.00 | 0.00 |
| Selling & Marketing | 0.00 | 0.00 | 0.00 | 0.00 | 0.00 | 0.00 | 0.00 | 0.00 | 0.00 | 0.00 | 0.00 | 0.00 | 0.00 | 0.00 | 0.00 | 0.00 | 0.00 | 0.00 | 0.00 |
| SG&A | 87.54M | 114.76M | 98.89M | 97.90M | 84.48M | 79.78M | 79.52M | 93.21M | 82.96M | 71.32M | 48.06M | 38.48M | 31.30M | 23.55M | 19.65M | 22.51M | 12.90M | 9.70M | 98.89M |
| Other Expenses | 0.00 | -12.31M | 7.63M | 507.00K | 1.43M | 637.00K | 385.00K | -1.17M | -1.16M | -857.00K | 502.00K | -189.00K | 0.00 | 0.00 | 0.00 | 0.00 | 0.00 | 0.00 | 7.89M |
| Operating Expenses | 113.49M | 153.26M | 136.83M | 134.36M | 116.12M | 109.81M | 110.34M | 131.63M | 122.22M | 114.75M | 67.79M | 55.08M | 45.24M | 36.55M | 31.96M | 36.53M | 27.29M | 25.29M | 144.73M |
| Cost & Expenses | 169.38M | 214.15M | 198.04M | 189.18M | 169.08M | 161.13M | 160.30M | 177.64M | 168.85M | 157.60M | 87.87M | 70.41M | 58.43M | 48.13M | 43.45M | 44.89M | 30.80M | 28.06M | 198.04M |
| Interest Income | 0.00 | 4.33M | 291.00K | 307.00K | 1.33M | 0.00 | 0.00 | 0.00 | 0.00 | 0.00 | 0.00 | 0.00 | 0.00 | 7.00K | 37.00K | 766.00K | 1.14M | 565.00K | 0.00 |
| Interest Expense | 4.57M | 4.33M | 3.82M | 3.57M | 4.28M | 13.89M | 5.82M | 5.82M | 5.81M | 5.34M | 14.00K | 628.00K | 3.10M | 2.16M | 2.88M | 2.03M | 2.79M | 2.26M | -3.82M |
| Depreciation & Amortization | 15.18M | 15.03M | 16.07M | 17.94M | 15.81M | 16.50M | 18.30M | 17.94M | 16.12M | 4.06M | 2.55M | 1.48M | 1.06M | 1.50M | 1.94M | 1.97M | 2.14M | 1.46M | 0.00 |
| EBITDA | -54.46M | -173.57M | -43.77M | -34.61M | -46.62M | -31.03M | -39.68M | -56.42M | -32.87M | -38.50M | -13.82M | -16.78M | -18.14M | -13.52M | -14.67M | -26.12M | -20.91M | -19.83M | -67.46M |
| EBITDA Ratio | -51.21% | -115.87% | -33.89% | -25.05% | -29.51% | -27.40% | -38.62% | -54.02% | -34.16% | -32.58% | -19.15% | -32.06% | -33.84% | -38.92% | -63.20% | -174.69% | -278.32% | -306.96% | -51.66% |
| Operating Income | -76.60M | -116.21M | -67.46M | -51.04M | -51.84M | -48.16M | -58.36M | -73.19M | -50.16M | -51.84M | -17.95M | -18.07M | -18.57M | -14.57M | -18.04M | -29.54M | -23.53M | -21.66M | -67.46M |
| Operating Income Ratio | -72.03% | -118.64% | -51.66% | -36.94% | -44.22% | -42.64% | -57.25% | -70.07% | -43.72% | -44.51% | -25.22% | -34.53% | -43.31% | -43.42% | -70.98% | -192.50% | -323.38% | -338.59% | -51.66% |
| Total Other Income/Expenses | 2.40M | -76.72M | 3.80M | -3.07M | -14.87M | -13.26M | -5.44M | -6.99M | -4.64M | -5.87M | 2.26M | -817.00K | -3.74M | -2.25M | -1.14M | -103.00K | -1.82M | -1.89M | 3.80M |
| Income Before Tax | -74.20M | -192.93M | -63.66M | -54.10M | -66.71M | -61.42M | -63.80M | -80.18M | -54.79M | -57.71M | -15.69M | -18.89M | -22.30M | -16.82M | -19.18M | -29.65M | -25.35M | -23.55M | -63.66M |
| Income Before Tax Ratio | -69.78% | -196.97% | -48.75% | -39.16% | -56.89% | -54.37% | -62.59% | -76.76% | -47.76% | -49.55% | -22.03% | -36.09% | -52.03% | -50.12% | -75.47% | -193.17% | -348.40% | -368.13% | -48.75% |
| Income Tax Expense | 452.00K | -2.83M | -4.42M | -1.08M | -1.92M | -2.41M | -3.26M | -4.19M | -1.48M | -4.88M | 137.00K | 136.00K | 166.00K | 83.00K | -50.00K | -147.00K | 105.00K | 194.00K | -4.42M |
| Net Income | -74.66M | -190.10M | -59.24M | -53.02M | -64.79M | -59.01M | -60.54M | -75.99M | -53.32M | -52.83M | -15.82M | -19.02M | -22.47M | -16.90M | -19.13M | -29.50M | -25.45M | -23.55M | -59.24M |
| Net Income Ratio | -70.21% | -194.08% | -45.36% | -38.38% | -55.26% | -52.24% | -59.38% | -72.75% | -46.48% | -45.36% | -22.23% | -36.35% | -52.42% | -50.36% | -75.27% | -192.21% | -349.84% | -368.13% | -45.36% |
| EPS | -0.94 | -2.43 | -0.78 | -0.74 | -0.97 | -1.49 | -1.84 | -2.62 | -1.86 | -1.90 | -0.62 | -0.86 | -1.26 | -0.89 | -11.02 | -17.85 | -13.47 | -12.46 | 0.00 |
| EPS Diluted | -0.94 | -2.43 | -0.78 | -0.74 | -0.97 | -1.49 | -1.84 | -2.62 | -1.86 | -1.90 | -0.62 | -0.86 | -1.26 | -0.89 | -11.02 | -17.85 | -13.47 | -12.46 | 0.00 |
| Weighted Avg Shares Out | 79.16M | 78.31M | 75.79M | 72.04M | 66.78M | 39.65M | 32.98M | 29.01M | 28.71M | 27.77M | 25.48M | 22.14M | 17.85M | 18.98M | 1.74M | 1.65M | 1.89M | 1.89M | 0.00 |
| Weighted Avg Shares Out (Dil) | 79.16M | 78.31M | 75.79M | 72.04M | 66.78M | 39.65M | 32.98M | 29.01M | 28.71M | 27.77M | 25.48M | 22.14M | 17.85M | 18.98M | 1.74M | 1.65M | 1.89M | 1.89M | 0.00 |

George Mason University Providing COVID-19 Testing with Saliva-Based Advanta Dx SARS-CoV-2 RT-PCR Assay on Biomark HD Platform

Earnings Preview: Fluidigm

NIH Sponsored Study at Stanford University School of Medicine to Utilize Fluidigm Mass Cytometry Technology and Maxpar Direct Immune Profiling Assay to Evaluate Immune Responses in Pediatric Patients with COVID-19

Fluidigm to Participate in BTIG Virtual MedTech, Digital Health, Life Science and Diagnostic Tools Conference

FLDM Stock Price Increased 11.2%: Why It Happened

Why Fluidigm Stock Is Flying Higher Today

Why Fluidigm, Seelos Therapeutics And More Are Moving Today

FLDM Stock Alert: Why Fluidigm Shares Are Shooting Higher Today

Fluidigm Receives CE-IVD Mark for Its Saliva-Based Advanta Dx SARS-CoV-2 RT-PCR Assay for COVID-19

Fluidigm Announces Conference Call and Webcast of Fourth Quarter and Full Year 2020 Financial Results
Source: https://incomestatements.info
Category: Stock Reports
