See more : Huayu Expressway Group Limited (1823.HK) Income Statement Analysis – Financial Results
Complete financial analysis of flyExclusive, Inc. (FLYX) income statement, including revenue, profit margins, EPS and key performance metrics. Get detailed insights into the financial performance of flyExclusive, Inc., a leading company in the Airlines, Airports & Air Services industry within the Industrials sector.
- Saturn Metals Limited (STN.AX) Income Statement Analysis – Financial Results
- Sansheng Holdings (Group) Co. Ltd. (2183.HK) Income Statement Analysis – Financial Results
- The Vitec Group plc (VTC.L) Income Statement Analysis – Financial Results
- Playgram Co., Ltd. (009810.KS) Income Statement Analysis – Financial Results
- Les Docks des Pétroles d’Ambès -SA (DPAM.PA) Income Statement Analysis – Financial Results
flyExclusive, Inc. (FLYX)
About flyExclusive, Inc.
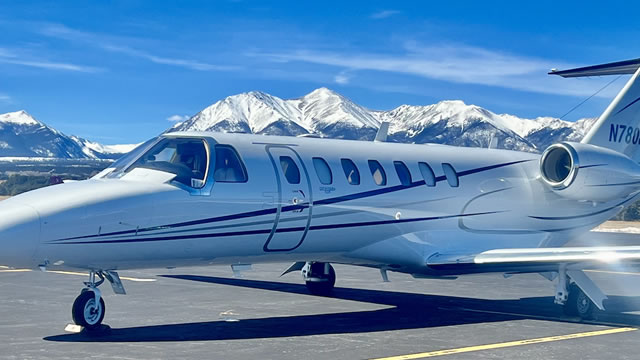
flyExclusive, Inc. owns and operates private jets worldwide. The company also offers jet charter services; ownership and leaseback programs for aircraft buyers; and aircraft maintenance, repair, interior, and paint services. In addition, it provides jet cards. The company is headquartered in Kinston, North Carolina. flyExclusive, Inc.operates as a subsidiary of LGM Enterprises, LLC.
| Metric | 2023 | 2022 | 2021 | 2020 |
|---|---|---|---|---|
| Revenue | 315.36M | 320.04M | 208.28M | 121.04M |
| Cost of Revenue | 291.16M | 278.56M | 159.24M | 85.81M |
| Gross Profit | 24.20M | 41.49M | 49.04M | 35.23M |
| Gross Profit Ratio | 7.67% | 12.96% | 23.55% | 29.11% |
| Research & Development | 0.00 | 0.00 | 0.00 | 0.00 |
| General & Administrative | 69.42M | 50.55M | -273.57K | 18.82M |
| Selling & Marketing | 6.01M | 3.24M | 1.28M | 1.04M |
| SG&A | 75.43M | 53.79M | 1.00M | 19.86M |
| Other Expenses | 0.00 | -282.00K | 307.00K | 140.00K |
| Operating Expenses | 75.43M | 53.79M | 1.00M | 35.97M |
| Cost & Expenses | 366.59M | 332.35M | 1.00M | 121.78M |
| Interest Income | 4.63M | 782.00K | 0.00 | 0.00 |
| Interest Expense | 22.22M | 8.29M | 4.22M | 5.34M |
| Depreciation & Amortization | 26.98M | 23.11M | 17.35M | 16.11M |
| EBITDA | -5.53M | 27.25M | 14.65M | 15.37M |
| EBITDA Ratio | -1.75% | 3.38% | -0.48% | 12.82% |
| Operating Income | -51.23M | -12.31M | -1.00M | -739.00K |
| Operating Income Ratio | -16.24% | -3.85% | -0.48% | -0.61% |
| Total Other Income/Expenses | -3.51M | 8.16M | 4.95M | 4.06M |
| Income Before Tax | -54.74M | -4.15M | 2.15M | 3.32M |
| Income Before Tax Ratio | -17.36% | -1.30% | 1.03% | 2.74% |
| Income Tax Expense | 0.00 | -10.20M | -17.35M | 1.77M |
| Net Income | -46.84M | 6.05M | 2.15M | 7.03M |
| Net Income Ratio | -14.85% | 1.89% | 1.03% | 5.81% |
| EPS | -0.61 | 0.22 | 0.08 | 0.42 |
| EPS Diluted | -2.81 | 0.22 | 0.08 | 0.42 |
| Weighted Avg Shares Out | 76.58M | 28.13M | 28.13M | 16.92M |
| Weighted Avg Shares Out (Dil) | 16.65M | 28.13M | 28.13M | 16.92M |

flyExclusive Receives Notice from NYSE American Regarding Late Filing of Annual Report on Form 10-K

flyExclusive Adds First Challenger 350 to Fractional Fleet

flyExclusive Announces $25 Million Equity Investment

flyExclusive Announces $25 Million Strategic Investment from ETG FE, LLC

FlyExclusive stock drops in debut after completing merger with blank check company
Source: https://incomestatements.info
Category: Stock Reports
