See more : Tysan Holdings Limited (0687.HK) Income Statement Analysis – Financial Results
Complete financial analysis of Fobi AI Inc. (FOBIF) income statement, including revenue, profit margins, EPS and key performance metrics. Get detailed insights into the financial performance of Fobi AI Inc., a leading company in the Software – Infrastructure industry within the Technology sector.
- MDU Resources Group, Inc. (MDU) Income Statement Analysis – Financial Results
- Cameco Corporation (CCJ) Income Statement Analysis – Financial Results
- PT Bank Pembangunan Daerah Jawa Barat dan Banten Tbk (BJBR.JK) Income Statement Analysis – Financial Results
- XP Chemistries AB (publ) (XPC.ST) Income Statement Analysis – Financial Results
- Alabama Power Company (ALP-PQ) Income Statement Analysis – Financial Results
Fobi AI Inc. (FOBIF)
About Fobi AI Inc.
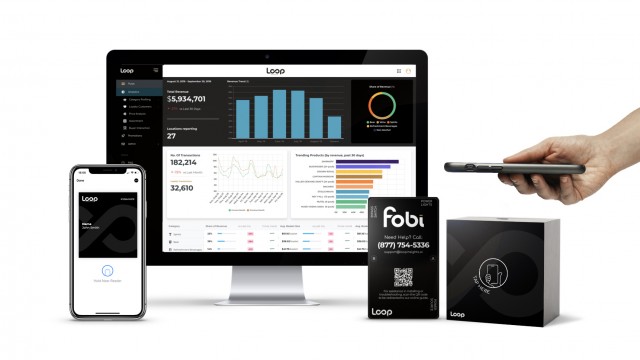
Fobi AI Inc., operates as a data intelligence company worldwide. The company offers artificial intelligence, automated marketing, contact tracing, and contactless solutions to the brick-and-mortar space. It also provides Fobi, a plug and play hardware or software that offers real-time, detailed insights and automated, and personalized engagement. The company serves telecom, casino gaming, sports and entertainment, hospitality, and retail industries. The company was formerly known as Loop Insights Inc. Fobi AI Inc. was incorporated in 2018 and is based in Vancouver, Canada.
| Metric | 2023 | 2022 | 2021 | 2020 | 2019 | 2018 | 2017 | 2016 | 2015 | 2014 | 2013 | 2012 | 2011 | 2010 | 2009 | 2008 |
|---|---|---|---|---|---|---|---|---|---|---|---|---|---|---|---|---|
| Revenue | 2.02M | 2.04M | 157.55K | 0.00 | 0.00 | 0.00 | 0.00 | 0.00 | 0.00 | 0.00 | 0.00 | 0.00 | 10.41K | 47.00 | 7.54K | 14.00K |
| Cost of Revenue | 4.35M | 1.39M | 36.34K | 60.26K | 520.75K | 11.99M | 0.00 | 0.00 | 0.00 | 0.00 | 0.00 | 0.00 | 0.00 | 0.00 | 0.00 | 0.00 |
| Gross Profit | -2.32M | 642.70K | 121.21K | -60.26K | -520.75K | -11.99M | 0.00 | 0.00 | 0.00 | 0.00 | 0.00 | 0.00 | 10.41K | 47.00 | 7.54K | 14.00K |
| Gross Profit Ratio | -114.92% | 31.56% | 76.93% | 0.00% | 0.00% | 0.00% | 0.00% | 0.00% | 0.00% | 0.00% | 0.00% | 0.00% | 100.00% | 100.00% | 100.00% | 100.00% |
| Research & Development | 528.61K | 1.02M | 167.85K | 63.82K | 561.21K | 0.00 | 0.00 | 0.00 | 0.00 | 0.00 | 0.00 | 0.00 | 0.00 | 0.00 | 0.00 | 0.00 |
| General & Administrative | 6.36M | 18.80M | 9.90M | 5.03M | 6.07M | 99.17K | 204.53K | 107.48K | 245.72K | 270.01K | 2.62M | 1.31M | 2.21M | 1.59M | 1.84M | 1.83M |
| Selling & Marketing | 374.43K | 530.30K | 1.06M | 282.73K | 21.62K | 62.49K | 0.00 | 0.00 | 0.00 | 0.00 | 0.00 | 0.00 | 0.00 | 0.00 | 0.00 | 0.00 |
| SG&A | 6.73M | 19.33M | 10.96M | 5.32M | 6.09M | 99.17K | 204.53K | 107.48K | 245.72K | 270.01K | 2.62M | 1.31M | 2.21M | 1.59M | 1.84M | 1.83M |
| Other Expenses | 3.83M | 1.39M | 107.90K | 60.26K | 1.33K | 0.00 | 0.00 | 0.00 | 0.00 | 0.00 | 0.00 | 0.00 | 0.00 | 0.00 | 0.00 | 0.00 |
| Operating Expenses | 11.10M | 20.73M | 11.24M | 5.44M | 6.65M | 98.70K | 523.81K | 107.48K | 245.72K | 270.01K | 2.63M | 1.33M | 2.12M | 1.18M | 1.87M | 1.83M |
| Cost & Expenses | 15.44M | 20.73M | 11.27M | 5.44M | 6.65M | 98.70K | 523.81K | 107.48K | 245.72K | 270.01K | 2.63M | 1.33M | 2.12M | 1.18M | 1.87M | 1.83M |
| Interest Income | 6.10K | 11.27K | 804.00 | 400.93K | 0.00 | 0.00 | 232.00 | 145.00 | 1.21K | 2.66K | 2.32K | 66.02K | 10.41K | 47.00 | 7.54K | 14.00K |
| Interest Expense | 42.07K | 134.60K | 18.02K | 204.30K | 0.00 | 0.00 | 0.00 | 0.00 | 0.00 | 0.00 | 0.00 | 0.00 | 194.97K | 363.82K | 97.74K | 0.00 |
| Depreciation & Amortization | 1.86M | 1.39M | 107.90K | 60.26K | 1.33K | 310.00 | 52.52K | 22.82K | 0.00 | 0.00 | 12.82K | 15.23K | 14.02K | 10.70K | 6.77K | 0.00 |
| EBITDA | -10.92M | -17.43M | -10.97M | -5.38M | -7.26M | -14.16M | -523.90K | -107.48K | -249.91K | -280.06K | 8.85M | -1.31M | -6.61M | -1.17M | -1.85M | -1.82M |
| EBITDA Ratio | -540.00% | -855.89% | -6,980.55% | 0.00% | 0.00% | 0.00% | 0.00% | 0.00% | 0.00% | 0.00% | 0.00% | 0.00% | -63,505.88% | -2,495,295.74% | -24,557.40% | -12,985.29% |
| Operating Income | -13.42M | -18.82M | -11.11M | -5.64M | 112.42K | -98.46K | -524.13K | -107.48K | -249.91K | -280.06K | 8.84M | -1.33M | -6.63M | -1.18M | -1.86M | -1.82M |
| Operating Income Ratio | -663.50% | -924.33% | -7,049.04% | 0.00% | 0.00% | 0.00% | 0.00% | 0.00% | 0.00% | 0.00% | 0.00% | 0.00% | -63,640.51% | -2,518,068.09% | -24,647.18% | -12,985.29% |
| Total Other Income/Expenses | 597.51K | -580.85K | 9.10K | 128.45K | -6.53M | 14.06M | 53.40K | 145.00 | 4.19K | 10.05K | -22.94M | 66.02K | 33.01K | 0.00 | 0.00 | 1.82M |
| Income Before Tax | -12.82M | -19.28M | -11.10M | -5.25M | -13.66M | -98.94K | -523.25K | -107.33K | -240.32K | -257.29K | -14.10M | -1.26M | -2.11M | 0.00 | 0.00 | 0.00 |
| Income Before Tax Ratio | -633.96% | -946.81% | -7,043.26% | 0.00% | 0.00% | 0.00% | 0.00% | 0.00% | 0.00% | 0.00% | 0.00% | 0.00% | -20,238.10% | 0.00% | 0.00% | 0.00% |
| Income Tax Expense | -71.32K | -128.84K | 27.22K | 597.31K | 13.78M | -72.00 | -53.07K | -22.82K | 0.00 | 0.00 | 11.47M | -66.02K | -4.32M | 363.82K | 97.74K | 2.61M |
| Net Income | -12.75M | -19.15M | -11.12M | -5.85M | -27.44M | -98.94K | -523.25K | -107.33K | -240.32K | -257.29K | -14.10M | -1.26M | 2.18M | -1.55M | -1.96M | -2.61M |
| Net Income Ratio | -630.43% | -940.48% | -7,060.53% | 0.00% | 0.00% | 0.00% | 0.00% | 0.00% | 0.00% | 0.00% | 0.00% | 0.00% | 20,974.54% | -3,292,155.32% | -25,943.98% | -18,675.72% |
| EPS | -0.08 | -0.14 | -0.09 | -0.09 | -0.60 | -0.02 | -0.09 | -0.02 | -0.04 | -0.05 | -2.63 | -0.24 | 0.60 | -0.48 | -0.64 | -0.98 |
| EPS Diluted | -0.08 | -0.14 | -0.09 | -0.09 | -0.60 | -0.02 | -0.09 | -0.02 | -0.04 | -0.05 | -2.63 | -0.24 | 0.60 | -0.48 | -0.64 | -0.98 |
| Weighted Avg Shares Out | 155.84M | 140.30M | 125.36M | 64.40M | 45.63M | 6.34M | 5.87M | 5.35M | 5.35M | 5.35M | 5.35M | 5.35M | 3.43M | 3.25M | 3.04M | 2.67M |
| Weighted Avg Shares Out (Dil) | 155.84M | 140.30M | 125.36M | 64.40M | 45.63M | 6.34M | 5.87M | 5.35M | 5.35M | 5.35M | 5.35M | 5.35M | 3.75M | 3.25M | 3.04M | 2.67M |

Fobi AI Signs Agreement with Vancouver Island Brewing to Launch New Digital Loyalty Program

Passcreator by Fobi Launches Digital Loyalty Program for the DACH Region (German, Austria, & Switzerland) with Leading Fashion Brand, Wormland

Fobi AI Inc. (FOBIF) Q3 2023 Earnings Call Transcript

Fobi AI acquires European digital wallet company Passworks

Fobi AI taps former ABI executive David Nicholls as VP of liquor beverage

Fobi AI inks annual Wallet Pass and AltID license agreement with ParcelPal Logistics

Fobi AI expands into Asia-Pacific region starting with Japan launch

Fobi AI inks $10M deal with BevWorks Brands to provide actionable data-driven insights

Fobi AI says granted US patent for its IoT (Internet of Things) hardware

Fobi AI subsidiary PulseIR adds another client in last-mile delivery firm ParcelPal
Source: https://incomestatements.info
Category: Stock Reports
