See more : Yincheng Life Service CO., Ltd. (1922.HK) Income Statement Analysis – Financial Results
Complete financial analysis of Ferro Corporation (FOE) income statement, including revenue, profit margins, EPS and key performance metrics. Get detailed insights into the financial performance of Ferro Corporation, a leading company in the Chemicals – Specialty industry within the Basic Materials sector.
- Mangalam Global Enterprise Limited (MGEL.NS) Income Statement Analysis – Financial Results
- Sharecare, Inc. (SHCRW) Income Statement Analysis – Financial Results
- Medion AG (MDN.DE) Income Statement Analysis – Financial Results
- ARTERIA Networks Corporation (4423.T) Income Statement Analysis – Financial Results
- MCH Group AG (0QPF.L) Income Statement Analysis – Financial Results
Ferro Corporation (FOE)
About Ferro Corporation
Ferro Corporation produces and markets specialty materials in Europe, the Middle East, Africa, the Asia Pacific, and the Americas region. The company operates through two segments, Functional Coatings and Color Solutions. It offers frits, porcelain and other glass enamels, glazes, stains, decorating colors, pigments, inks, polishing materials, dielectrics, electronic glasses, and other specialty coatings. The company's products are used in appliances, electronics, automotive, industrial products, building and renovation, packaging, consumer products, sanitary, construction, healthcare, food and beverage, information technology, energy, and defense industries. It markets and sells its products directly, as well as through agents and distributors. The company was incorporated in 1919 and is headquartered in Mayfield Heights, Ohio. As of April 21, 2022, Ferro Corporation operates as a subsidiary of Prince International Corporation.
| Metric | 2021 | 2020 | 2019 | 2018 | 2017 | 2016 | 2015 | 2014 | 2013 | 2012 | 2011 | 2010 | 2009 | 2008 | 2007 | 2006 | 2005 | 2004 | 2003 | 2002 | 2001 | 2000 | 1999 | 1998 | 1997 | 1996 | 1995 | 1994 | 1993 | 1992 | 1991 | 1990 | 1989 | 1988 | 1987 | 1986 | 1985 |
|---|---|---|---|---|---|---|---|---|---|---|---|---|---|---|---|---|---|---|---|---|---|---|---|---|---|---|---|---|---|---|---|---|---|---|---|---|---|
| Revenue | 1.13B | 958.95M | 1.02B | 1.61B | 1.40B | 1.15B | 1.08B | 1.11B | 1.64B | 1.77B | 2.16B | 2.10B | 1.66B | 2.25B | 2.20B | 2.04B | 1.88B | 1.84B | 1.62B | 1.53B | 1.50B | 1.45B | 1.36B | 1.36B | 1.38B | 1.36B | 1.32B | 1.19B | 1.07B | 1.10B | 1.06B | 1.12B | 1.08B | 1.01B | 871.10M | 725.20M | 651.10M |
| Cost of Revenue | 781.65M | 665.20M | 709.55M | 1.16B | 980.52M | 794.08M | 773.66M | 826.54M | 1.31B | 1.47B | 1.74B | 1.64B | 1.34B | 1.84B | 1.79B | 1.63B | 1.50B | 1.46B | 1.24B | 1.14B | 1.13B | 1.00B | 928.40M | 954.50M | 983.10M | 973.80M | 957.30M | 853.90M | 745.60M | 775.30M | 763.70M | 826.40M | 779.20M | 714.80M | 628.50M | 519.50M | 480.10M |
| Gross Profit | 344.62M | 293.76M | 308.82M | 455.93M | 416.22M | 351.22M | 301.68M | 285.09M | 329.72M | 297.86M | 413.19M | 458.67M | 314.27M | 403.67M | 416.66M | 414.79M | 380.95M | 382.21M | 381.27M | 385.13M | 367.38M | 444.42M | 426.90M | 407.30M | 398.20M | 381.90M | 365.70M | 340.40M | 320.10M | 322.50M | 293.20M | 298.40M | 304.40M | 294.20M | 242.60M | 205.70M | 171.00M |
| Gross Profit Ratio | 30.60% | 30.63% | 30.32% | 28.28% | 29.80% | 30.67% | 28.05% | 25.65% | 20.16% | 16.84% | 19.17% | 21.82% | 18.96% | 17.98% | 18.90% | 20.32% | 20.24% | 20.73% | 23.50% | 25.20% | 24.47% | 30.71% | 31.50% | 29.91% | 28.83% | 28.17% | 27.64% | 28.50% | 30.04% | 29.38% | 27.74% | 26.53% | 28.09% | 29.16% | 27.85% | 28.36% | 26.26% |
| Research & Development | 32.59M | 35.62M | 40.96M | 40.22M | 36.36M | 0.00 | 0.00 | 0.00 | 0.00 | 0.00 | 0.00 | 0.00 | 0.00 | 0.00 | 0.00 | 0.00 | 0.00 | 0.00 | 0.00 | 0.00 | 0.00 | 0.00 | 0.00 | 0.00 | 0.00 | 0.00 | 0.00 | 0.00 | 0.00 | 0.00 | 0.00 | 0.00 | 0.00 | 0.00 | 0.00 | 0.00 | 0.00 |
| General & Administrative | 179.34M | 160.62M | 164.29M | 229.35M | 211.91M | 240.32M | 216.23M | 284.11M | 172.21M | 0.00 | 0.00 | 0.00 | 0.00 | 0.00 | 0.00 | 0.00 | 0.00 | 0.00 | 0.00 | 0.00 | 283.00M | 254.60M | 241.80M | 235.20M | 233.70M | 226.50M | 223.10M | 212.00M | 0.00 | 0.00 | 0.00 | 0.00 | 0.00 | 0.00 | 0.00 | 0.00 | 0.00 |
| Selling & Marketing | 0.00 | 0.00 | 0.00 | 0.00 | 0.00 | 0.00 | 0.00 | 0.00 | 0.00 | 0.00 | 0.00 | 0.00 | 0.00 | 0.00 | 0.00 | 0.00 | 0.00 | 0.00 | 0.00 | 0.00 | 0.00 | 0.00 | 0.00 | 0.00 | 0.00 | 0.00 | 0.00 | 0.00 | 0.00 | 0.00 | 0.00 | 0.00 | 0.00 | 0.00 | 0.00 | 0.00 | 0.00 |
| SG&A | 179.34M | 160.62M | 164.29M | 229.35M | 211.91M | 240.32M | 216.23M | 284.11M | 172.21M | 302.66M | 294.80M | 293.74M | 272.26M | 297.12M | 319.07M | 305.21M | 310.88M | 312.44M | 309.28M | 282.46M | 283.00M | 254.60M | 241.80M | 235.20M | 233.70M | 226.50M | 223.10M | 212.00M | 187.40M | 184.20M | 231.20M | 200.40M | 185.20M | 171.50M | 153.10M | 131.80M | 121.20M |
| Other Expenses | -2.29M | 5.93M | 6.65M | 8.82M | 6.74M | 1.13M | 1.07M | 515.00K | 8.33M | 0.00 | 0.00 | 0.00 | 0.00 | 0.00 | 0.00 | 0.00 | 0.00 | 0.00 | 0.00 | 0.00 | 0.00 | 50.35M | 48.50M | 43.10M | 45.00M | 49.60M | 46.30M | 42.70M | 38.30M | 34.60M | 33.90M | 32.00M | 28.60M | 26.10M | 21.90M | 18.90M | 16.80M |
| Operating Expenses | 209.64M | 202.16M | 211.89M | 278.39M | 255.01M | 241.45M | 217.30M | 284.62M | 180.54M | 302.66M | 294.80M | 293.74M | 272.26M | 297.12M | 319.07M | 305.21M | 310.88M | 312.44M | 309.28M | 282.46M | 283.00M | 304.95M | 290.30M | 278.30M | 278.70M | 276.10M | 269.40M | 254.70M | 225.70M | 218.80M | 265.10M | 232.40M | 213.80M | 197.60M | 175.00M | 150.70M | 138.00M |
| Cost & Expenses | 991.28M | 867.36M | 921.44M | 1.43B | 1.24B | 1.04B | 990.96M | 1.11B | 1.49B | 1.77B | 2.04B | 1.94B | 1.62B | 2.14B | 2.11B | 1.93B | 1.81B | 1.77B | 1.55B | 1.43B | 1.42B | 1.31B | 1.22B | 1.23B | 1.26B | 1.25B | 1.23B | 1.11B | 971.30M | 994.10M | 1.03B | 1.06B | 993.00M | 912.40M | 803.50M | 670.20M | 618.10M |
| Interest Income | 1.79M | 3.26M | 4.59M | 1.44M | 901.00K | 630.00K | 363.00K | 118.00K | 271.00K | 311.00K | 285.00K | 651.00K | 896.00K | 714.00K | 1.51M | 4.47M | 538.00K | 887.00K | 892.00K | 1.04M | 2.59M | 0.00 | 0.00 | 0.00 | 0.00 | 0.00 | 0.00 | 0.00 | 0.00 | 0.00 | 0.00 | 0.00 | 0.00 | 0.00 | 0.00 | 0.00 | 0.00 |
| Interest Expense | 27.02M | 19.17M | 21.81M | 30.56M | 24.26M | 20.19M | 14.04M | 14.93M | 24.43M | 26.03M | 28.41M | 44.57M | 63.92M | 0.00 | 0.00 | 0.00 | 0.00 | 0.00 | 0.00 | 0.00 | 0.00 | 0.00 | 0.00 | 0.00 | 0.00 | 0.00 | 0.00 | 0.00 | 0.00 | 0.00 | 0.00 | 0.00 | 0.00 | 0.00 | 0.00 | 0.00 | 0.00 |
| Depreciation & Amortization | 40.21M | 40.29M | 55.88M | 53.97M | 50.09M | 46.81M | 41.06M | 38.49M | 50.03M | 57.38M | 63.49M | 76.94M | 88.14M | 73.45M | 87.48M | 79.50M | 74.82M | 70.39M | 70.39M | 64.25M | 67.79M | 50.35M | 48.50M | 43.10M | 45.00M | 49.60M | 46.30M | 42.70M | 38.30M | 34.60M | 33.90M | 32.00M | 28.60M | 26.10M | 21.90M | 18.90M | 16.80M |
| EBITDA | 255.28M | 117.12M | 91.85M | 187.67M | 184.15M | 64.05M | 74.10M | 105.26M | 161.27M | -181.37M | 157.11M | 143.67M | 105.63M | 30.96M | -22.07M | 104.62M | 98.03M | 98.66M | 96.80M | 152.81M | 129.25M | 166.97M | 164.60M | 153.60M | -3.50M | 137.80M | 126.50M | 117.00M | 107.00M | 132.30M | 54.20M | 75.50M | 112.30M | 114.50M | 81.90M | 63.40M | 35.10M |
| EBITDA Ratio | 22.67% | 12.21% | 9.02% | 11.64% | 13.18% | 5.59% | 6.89% | 9.47% | 9.86% | -10.25% | 7.29% | 6.84% | 6.37% | 1.38% | -1.00% | 5.12% | 5.21% | 5.35% | 5.97% | 10.00% | 8.61% | 11.54% | 12.14% | 11.28% | -0.25% | 10.16% | 9.56% | 9.80% | 10.04% | 12.05% | 5.13% | 6.71% | 10.36% | 11.35% | 9.40% | 8.74% | 5.39% |
| Operating Income | 215.07M | 91.60M | 96.92M | 177.54M | 161.21M | 109.77M | 84.38M | 465.00K | 149.18M | -4.80M | 118.39M | 164.93M | 42.01M | 80.61M | 79.40M | 86.50M | 70.14M | 74.96M | 72.00M | 102.67M | 84.39M | 139.47M | 136.60M | 129.00M | 119.50M | 105.80M | 96.30M | 85.70M | 94.40M | 103.70M | 28.10M | 66.00M | 90.60M | 96.60M | 67.60M | 55.00M | 33.00M |
| Operating Income Ratio | 19.10% | 9.55% | 9.52% | 11.01% | 11.54% | 9.58% | 7.85% | 0.04% | 9.12% | -0.27% | 5.49% | 7.85% | 2.53% | 3.59% | 3.60% | 4.24% | 3.73% | 4.07% | 4.44% | 6.72% | 5.62% | 9.64% | 10.08% | 9.47% | 8.65% | 7.80% | 7.28% | 7.18% | 8.86% | 9.45% | 2.66% | 5.87% | 8.36% | 9.57% | 7.76% | 7.58% | 5.07% |
| Total Other Income/Expenses | -102.51M | -46.70M | -53.41M | -73.55M | -50.69M | -47.33M | -29.60M | -43.30M | -53.45M | -258.75M | -52.45M | -141.19M | -85.57M | -137.15M | -188.72M | -60.91M | -46.07M | -43.77M | -47.75M | -54.09M | -22.92M | -22.85M | -20.50M | -18.50M | -168.00M | -17.60M | -16.10M | -11.40M | -5.10M | -6.00M | -7.80M | -22.50M | -6.90M | -8.20M | -7.60M | -10.50M | -14.70M |
| Income Before Tax | 112.56M | 44.90M | 43.51M | 103.99M | 110.52M | 62.45M | 54.78M | -42.84M | 95.73M | -263.55M | 65.94M | 23.74M | -43.56M | -56.54M | -109.32M | 25.59M | 24.07M | 31.19M | 24.24M | 48.58M | 61.47M | 116.62M | 116.10M | 110.50M | -48.50M | 88.20M | 80.20M | 74.30M | 89.30M | 97.70M | 20.30M | 43.50M | 83.70M | 88.40M | 60.00M | 44.50M | 18.30M |
| Income Before Tax Ratio | 9.99% | 4.68% | 4.27% | 6.45% | 7.91% | 5.45% | 5.09% | -3.85% | 5.85% | -14.90% | 3.06% | 1.13% | -2.63% | -2.52% | -4.96% | 1.25% | 1.28% | 1.69% | 1.49% | 3.18% | 4.09% | 8.06% | 8.57% | 8.11% | -3.51% | 6.51% | 6.06% | 6.22% | 8.38% | 8.90% | 1.92% | 3.87% | 7.72% | 8.76% | 6.89% | 6.14% | 2.81% |
| Income Tax Expense | 39.22M | 14.86M | 8.12M | 23.05M | 52.75M | 17.87M | -45.10M | -34.23M | 14.87M | 109.49M | 33.57M | 16.47M | -3.52M | -2.79M | -15.06M | 5.03M | 6.93M | 3.35M | 6.86M | 14.83M | 22.27M | 43.48M | 43.10M | 41.20M | -11.20M | 33.60M | 30.90M | 26.90M | 31.80M | 38.90M | 15.50M | 24.10M | 34.00M | 41.80M | 28.30M | 20.40M | 9.40M |
| Net Income | 73.34M | 42.80M | 6.04M | 80.09M | 57.05M | -20.82M | 64.10M | 86.07M | 71.94M | -374.27M | 31.64M | 5.70M | -42.92M | -39.70M | -94.48M | 20.09M | 16.28M | 24.93M | 19.55M | 73.72M | 39.20M | 73.14M | 73.00M | 69.30M | -37.30M | 54.60M | 49.30M | 47.40M | 36.90M | 58.80M | 4.80M | 19.40M | 49.70M | 46.60M | 31.70M | 24.10M | 8.90M |
| Net Income Ratio | 6.51% | 4.46% | 0.59% | 4.97% | 4.08% | -1.82% | 5.96% | 7.74% | 4.40% | -21.16% | 1.47% | 0.27% | -2.59% | -1.77% | -4.29% | 0.98% | 0.86% | 1.35% | 1.21% | 4.82% | 2.61% | 5.05% | 5.39% | 5.09% | -2.70% | 4.03% | 3.73% | 3.97% | 3.46% | 5.36% | 0.45% | 1.72% | 4.59% | 4.62% | 3.64% | 3.32% | 1.37% |
| EPS | 0.88 | 0.52 | 0.07 | 0.94 | 0.68 | -0.25 | 0.74 | 0.99 | 0.83 | -4.34 | 0.37 | 0.07 | -0.84 | -0.92 | -2.20 | 0.47 | 0.39 | 0.59 | 0.48 | 1.92 | 1.14 | 2.12 | 2.08 | 1.90 | -0.98 | 1.37 | 1.18 | 1.09 | 0.83 | 1.34 | 0.09 | 0.45 | 1.07 | 1.01 | 0.68 | 0.53 | 0.19 |
| EPS Diluted | 0.88 | 0.52 | 0.07 | 0.94 | 0.67 | -0.25 | 0.72 | 0.99 | 0.82 | -4.34 | 0.36 | 0.07 | -0.84 | -0.92 | -2.20 | 0.47 | 0.39 | 0.59 | 0.48 | 1.85 | 1.13 | 2.02 | 1.95 | 1.77 | -0.98 | 1.30 | 1.12 | 1.09 | 0.80 | 1.25 | 0.09 | 0.42 | 1.01 | 1.01 | 0.68 | 0.53 | 0.19 |
| Weighted Avg Shares Out | 83.69M | 83.02M | 82.89M | 85.09M | 83.71M | 83.30M | 86.72M | 86.92M | 86.48M | 86.29M | 86.12M | 85.82M | 50.93M | 43.26M | 42.93M | 42.39M | 42.25M | 42.22M | 40.61M | 38.32M | 34.40M | 34.49M | 35.18M | 36.39M | 38.06M | 39.77M | 41.71M | 43.51M | 44.53M | 43.78M | 53.33M | 43.51M | 46.57M | 46.14M | 46.62M | 45.47M | 46.84M |
| Weighted Avg Shares Out (Dil) | 83.69M | 83.02M | 82.89M | 85.09M | 85.16M | 84.91M | 88.43M | 86.92M | 87.50M | 86.29M | 86.78M | 86.54M | 50.93M | 43.26M | 42.93M | 42.42M | 42.25M | 42.22M | 40.61M | 39.82M | 34.73M | 36.29M | 37.46M | 39.22M | 38.06M | 41.95M | 43.85M | 43.51M | 46.39M | 47.12M | 53.33M | 46.00M | 48.97M | 46.14M | 46.62M | 45.47M | 46.84M |

Ferro into last 16 as fellow Frenchwoman Burel misses out

Handelsbanken Fonder AB Makes New $254,000 Investment in Ferro Co. (NYSE:FOE)

Vanadium Miners News For The Month Of September 2020

French Open 2020: Djokovic through, Watson goes out to Ferro – as it happened

Vanguard Group Inc. Sells 150,052 Shares of Ferro Co. (NYSE:FOE)

Why Stocks Could Be Ready To Rally

The Sell-Off Accelerates, What To Do Now

The Best Stocks To Buy On A Sell-Off

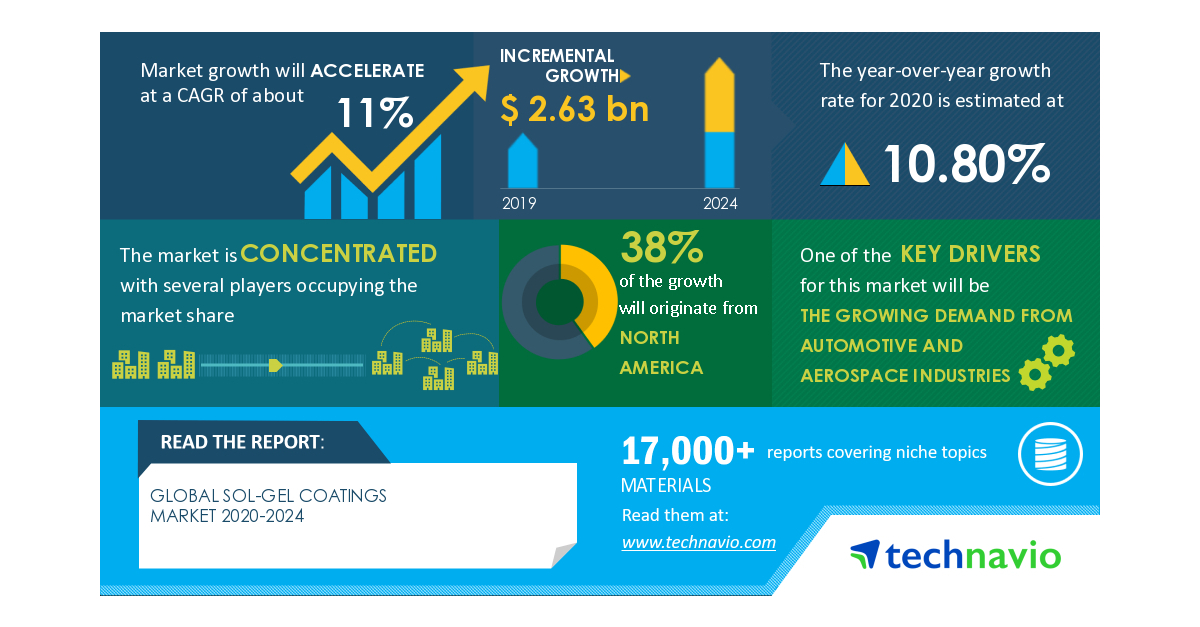
COVID-19 Impacts: Sol-gel Coatings Market will Accelerate at a CAGR of about 11% through 2020-2024 | The Growing Demand From Automotive And Aerospace Industries to Boost Growth | Technavio
Source: https://incomestatements.info
Category: Stock Reports

