See more : Hwacheon Machinery Co., Ltd. (010660.KS) Income Statement Analysis – Financial Results
Complete financial analysis of FlexShopper, Inc. (FPAY) income statement, including revenue, profit margins, EPS and key performance metrics. Get detailed insights into the financial performance of FlexShopper, Inc., a leading company in the Rental & Leasing Services industry within the Industrials sector.
- Messaben Corp. (MSBN) Income Statement Analysis – Financial Results
- Education Management Corporation (EDMCQ) Income Statement Analysis – Financial Results
- Africa Energy Corp. (AFE.V) Income Statement Analysis – Financial Results
- Maximus Resources Limited (MXR.AX) Income Statement Analysis – Financial Results
- Photronics, Inc. (PLAB) Income Statement Analysis – Financial Results
FlexShopper, Inc. (FPAY)
About FlexShopper, Inc.
FlexShopper, Inc., a financial technology company, operates an e-commerce marketplace to shop electronics, home furnishings, and other durable goods on a lease-to-own (LTO) basis. It offers durable products, including consumer electronics; home appliances; computers, including tablets and wearables; smartphones; tires; and jewelry and furniture, such as accessories. The company was formerly known as Anchor Funding Services, Inc. and changed its name to FlexShopper, Inc. in October 2013. FlexShopper, Inc. was founded in 2003 and is headquartered in Boca Raton, Florida.
| Metric | 2023 | 2022 | 2021 | 2020 | 2019 | 2018 | 2017 | 2016 | 2015 | 2014 | 2013 | 2012 | 2011 | 2010 | 2009 | 2008 | 2007 | 2006 |
|---|---|---|---|---|---|---|---|---|---|---|---|---|---|---|---|---|---|---|
| Revenue | 116.98M | 113.06M | 125.43M | 102.08M | 88.79M | 84.73M | 67.05M | 47.58M | 20.68M | 5.01M | 1.98M | 2.06M | 1.89M | 1.69M | 1.59M | 1.28M | 595.70K | 558.82K |
| Cost of Revenue | 12.50M | 3.38M | 79.18M | 66.73M | 60.22M | 42.06M | 32.45M | 23.42M | 11.07M | 3.33M | 124.00 | 41.80K | 0.00 | 0.00 | 0.00 | 0.00 | 0.00 | 558.82K |
| Gross Profit | 104.48M | 109.67M | 46.25M | 35.35M | 28.57M | 42.67M | 34.59M | 24.16M | 9.61M | 1.68M | 1.98M | 2.02M | 1.89M | 1.69M | 1.59M | 1.28M | 595.70K | 0.00 |
| Gross Profit Ratio | 89.31% | 97.01% | 36.87% | 34.63% | 32.17% | 50.36% | 51.60% | 50.77% | 46.48% | 33.58% | 99.99% | 97.97% | 100.00% | 100.00% | 100.00% | 100.00% | 100.00% | 0.00% |
| Research & Development | 0.00 | -0.03 | 0.03 | 0.00 | 105.58K | -0.15 | -0.12 | -0.26 | 0.00 | 0.00 | 0.00 | 0.00 | 0.00 | 0.00 | 0.00 | 0.00 | 0.00 | 0.00 |
| General & Administrative | 12.50M | 10.99M | 11.49M | 10.44M | 8.47M | 11.14M | 7.86M | 5.95M | 15.33M | 8.51M | 0.00 | 0.00 | 0.00 | 0.00 | 0.00 | 0.00 | 0.00 | 0.00 |
| Selling & Marketing | 7.62M | 11.03M | 9.13M | 5.88M | 3.65M | 7.05M | 6.09M | 10.19M | 4.39M | 885.01K | 0.00 | 0.00 | 0.00 | 0.00 | 0.00 | 0.00 | 0.00 | 0.00 |
| SG&A | 20.12M | 22.02M | 20.62M | 16.32M | 12.12M | 18.19M | 13.96M | 16.14M | 19.72M | 8.51M | 655.47K | 1.64M | 0.00 | 0.00 | 0.00 | 0.00 | 0.00 | 0.00 |
| Other Expenses | 70.67M | 93.95M | 18.27M | 14.40M | 11.35M | 28.34M | 23.54M | 18.35M | -1.62M | -1.95M | -2.61M | -1.64M | 0.00 | 0.00 | 0.00 | 2.49M | 1.61M | 0.00 |
| Operating Expenses | 90.79M | 115.98M | 38.88M | 30.73M | 23.46M | 46.53M | 40.76M | 34.49M | 18.10M | 6.56M | -2.61M | -1.64M | -1.60M | -1.65M | -3.22M | 2.49M | 1.61M | 0.00 |
| Cost & Expenses | 103.28M | 119.36M | 118.06M | 97.46M | 83.69M | 88.59M | 73.21M | 57.91M | 29.17M | 9.89M | -2.61M | -1.64M | -1.60M | -1.65M | -3.22M | 2.49M | 1.61M | 416.93K |
| Interest Income | 0.00 | 14.55M | 5.75M | 4.30M | 4.31M | 0.00 | 0.00 | 2.36M | 2.53M | 2.40M | 2.52M | 1.70M | 1.29M | 199.97K | 0.00 | |||
| Interest Expense | 18.91M | 11.16M | 5.24M | 4.30M | 4.31M | 506.41K | 0.00 | 385.92K | 469.36K | 517.13K | 827.80K | 111.20K | 9.66K | 27.29K | 0.00 | |||
| Depreciation & Amortization | 0.00 | 117.44M | 115.59M | 127.51M | 88.00M | 70.82M | 75.38M | 59.83M | 10.33M | 2.33M | 38.33K | 19.80K | 20.56K | 30.27K | 305.85K | 46.01K | 26.03K | 5.48K |
| EBITDA | 13.69M | 71.02M | 90.84M | 4.63M | 5.10M | 37.87M | 27.38M | 13.97M | 3.82M | -4.42M | -617.15K | 868.03K | 299.79K | 41.53K | -1.58M | -1.21M | -1.02M | 147.36K |
| EBITDA Ratio | 11.70% | 62.82% | 66.85% | 66.55% | 74.20% | 44.70% | 40.84% | 29.37% | 8.87% | -50.82% | -13.62% | 42.19% | 43.28% | 51.50% | -92.62% | -94.47% | -166.76% | 26.37% |
| Operating Income | 13.69M | -6.30M | 7.36M | 4.63M | 5.10M | -5.18M | -6.16M | -10.33M | -8.49M | -4.88M | -693.68K | 378.86K | 279.23K | 11.26K | -1.89M | -1.27M | -1.05M | 141.89K |
| Operating Income Ratio | 11.70% | -5.58% | 5.87% | 4.53% | 5.75% | -6.11% | -9.19% | -21.71% | -41.06% | -97.22% | -35.07% | 18.42% | 14.79% | 0.67% | -118.88% | -98.81% | -175.70% | 25.39% |
| Total Other Income/Expenses | -18.91M | 3.30M | -3.31M | -4.30M | -4.31M | -4.28M | -2.17M | -1.93M | -994.12K | -7.08K | -38.21K | 0.00 | 0.00 | 0.00 | 0.00 | -9.66K | 0.00 | 0.00 |
| Income Before Tax | -5.22M | -3.00M | 4.06M | 323.15K | 793.82K | -9.46M | -8.33M | -12.25M | -9.00M | -4.88M | -693.68K | 378.86K | 279.23K | 11.26K | -1.89M | -1.27M | -1.05M | 141.89K |
| Income Before Tax Ratio | -4.47% | -2.66% | 3.24% | 0.32% | 0.89% | -11.17% | -12.43% | -25.75% | -43.51% | -97.22% | -35.07% | 18.42% | 14.79% | 0.67% | -118.88% | -98.81% | -175.70% | 25.39% |
| Income Tax Expense | -989.81K | -16.64M | 785.31K | 663.05K | 216.40K | -126.62K | -5.16M | -9.26M | -78.39K | -458.05K | 385.92K | 469.36K | 517.13K | 735.14K | 112.35K | 9.66K | 27.29K | 0.00 |
| Net Income | -4.23M | 13.63M | 3.27M | -339.90K | 577.42K | -9.46M | -8.33M | -12.25M | -8.79M | -3.73M | -693.68K | 378.86K | 275.23K | -377.91K | -1.89M | -1.27M | -1.05M | 141.89K |
| Net Income Ratio | -3.62% | 12.06% | 2.61% | -0.33% | 0.65% | -11.17% | -12.43% | -25.75% | -42.51% | -74.39% | -35.07% | 18.42% | 14.58% | -22.39% | -118.95% | -98.81% | -175.70% | 25.39% |
| EPS | -0.51 | 0.63 | 0.15 | -0.02 | -0.11 | -1.10 | -1.57 | -2.33 | -1.69 | -1.07 | -0.33 | 0.20 | 0.10 | -0.21 | -1.43 | -1.00 | -0.94 | 0.00 |
| EPS Diluted | -0.51 | 0.61 | 0.14 | -0.02 | -0.11 | -1.10 | -1.57 | -2.32 | -1.69 | -1.07 | -0.33 | 0.20 | 0.10 | -0.18 | -1.43 | -1.00 | -0.94 | 0.00 |
| Weighted Avg Shares Out | 16.26M | 21.65M | 21.39M | 21.00M | 17.67M | 8.57M | 5.29M | 5.25M | 5.21M | 3.50M | 2.11M | 1.86M | 1.86M | 1.78M | 1.32M | 1.27M | 1.11M | 0.00 |
| Weighted Avg Shares Out (Dil) | 16.26M | 22.43M | 23.23M | 21.00M | 17.67M | 8.57M | 5.29M | 5.29M | 5.21M | 3.50M | 2.11M | 2.08M | 2.05M | 2.06M | 1.32M | 1.27M | 1.11M | 0.00 |
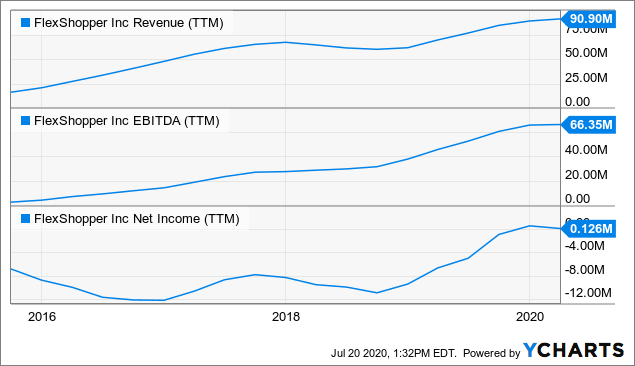
Crunch Time For FlexShopper

Dutch farmers protest move to cut emissions from livestock

A Bit About Archiving
LTO tape shipments hit capacity record in 2019 – Blocks and Files
Here’s why tape will always surpass hard drives and SSDs in storage
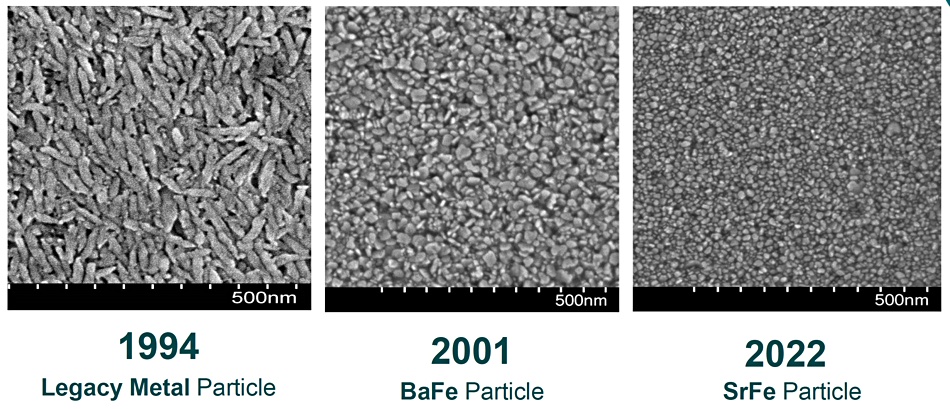
Fujifilm points to 400TB tape cartridge on the horizon – Blocks and Files
Global Lithium Ion Battery Market Size & Share to Touch USD 80 Billion By 2026: Facts & Factors

How LTO Network Shows B2B Adoption Using Metrics That Matter | Crypto Briefing
Source: https://incomestatements.info
Category: Stock Reports

