See more : Sea Limited (SE) Income Statement Analysis – Financial Results
Complete financial analysis of FS KKR Capital Corp. II (FSKR) income statement, including revenue, profit margins, EPS and key performance metrics. Get detailed insights into the financial performance of FS KKR Capital Corp. II, a leading company in the Asset Management industry within the Financial Services sector.
- RSD Finance Limited (RSDFIN.BO) Income Statement Analysis – Financial Results
- LVMH Moët Hennessy – Louis Vuitton, Société Européenne (MC.PA) Income Statement Analysis – Financial Results
- PT Bakrie & Brothers Tbk (BNBR.JK) Income Statement Analysis – Financial Results
- Goldsource Mines Inc. (GXSFF) Income Statement Analysis – Financial Results
- Tishman Speyer Innovation Corp. II (TSIBW) Income Statement Analysis – Financial Results
FS KKR Capital Corp. II (FSKR)
Industry: Asset Management
Sector: Financial Services
About FS KKR Capital Corp. II
FS KKR Capital Corp. II, formerly known as FS Investment Corp II, is a business development company specializing in investments in floating rate, senior secured loans-first lien and second line, senior secured bonds, subordinated debt, collateralized securities, corporate bonds, debt securities, equity such as warrants or options in middle market private companies. The fund does not intend to invest to any significant degree in start-up companies, turnaround situations or companies with speculative business plans. It seeks to invest in various sectors such as consumer services, energy, capital goods, software and services, telecommunication services, consumer durables and apparel, diversified financials, materials, automobiles and components, commercial and professional services, media, technology hardware and equipment, health care equipment and services, insurance, retailing, transportation, pharmaceuticals, biotechnology, and life sciences, food and staples retailing, food, beverage, and tobacco, household and personal products, real estate, and utilities. The fund seeks to invest in private companies based in the United States. It also invests in non-U.S. securities, which may include securities denominated in U.S. dollars or in non-U.S. currencies, to the extent permitted by the 1940 Act. The fund purchase interests in loans through secondary market transactions in the ?over-the-counter? market for institutional loans or directly from our target companies. It also purchase minority interests in the form of common or preferred equity in target companies, either in conjunction with one of its debt investments or through a co-investment with a financial sponsor, such as an institutional investor or private equity firm. It may have board representation or board observation rights in its portfolio companies.
| Metric | 2020 | 2019 | 2018 | 2017 | 2016 | 2015 |
|---|---|---|---|---|---|---|
| Revenue | -261.00M | 460.00M | 453.98M | 523.69M | 488.05M | 529.46M |
| Cost of Revenue | 0.00 | 207.00M | 206.84M | 250.83M | 230.42M | 233.85M |
| Gross Profit | -261.00M | 253.00M | 247.15M | 272.85M | 257.63M | 295.62M |
| Gross Profit Ratio | 100.00% | 55.00% | 54.44% | 52.10% | 52.79% | 55.83% |
| Research & Development | 0.00 | 0.00 | 0.00 | 0.00 | 0.00 | 0.00 |
| General & Administrative | 24.00M | 14.00M | 11.73M | 12.16M | 13.34M | 13.34M |
| Selling & Marketing | 0.00 | 0.00 | 0.00 | 0.00 | 0.00 | 0.00 |
| SG&A | 24.00M | 14.00M | 11.73M | 12.16M | 13.34M | 13.34M |
| Other Expenses | 91.00M | 0.00 | -3.43M | -12.93M | -12.08M | -10.25M |
| Operating Expenses | 115.00M | 14.00M | 8.30M | -766.00K | 1.27M | 3.08M |
| Cost & Expenses | 372.00M | 221.00M | 215.14M | 250.07M | 231.69M | 236.93M |
| Interest Income | 0.00 | 0.00 | 0.00 | 0.00 | 0.00 | 0.00 |
| Interest Expense | 130.00M | -146.00M | -273.81M | -81.50M | 162.92M | -351.63M |
| Depreciation & Amortization | -192.00M | -292.00M | -547.61M | -162.99M | 325.84M | -703.26M |
| EBITDA | -438.00M | -53.00M | -308.77M | 110.63M | 582.20M | -410.73M |
| EBITDA Ratio | 167.82% | -11.52% | -68.01% | 21.13% | 119.29% | -77.57% |
| Operating Income | 359.00M | 239.00M | 238.85M | 273.62M | 256.36M | 292.53M |
| Operating Income Ratio | -137.55% | 51.96% | 52.61% | 52.25% | 52.53% | 55.25% |
| Total Other Income/Expenses | -735.00M | -146.00M | -273.81M | -81.50M | 162.92M | -351.63M |
| Income Before Tax | -376.00M | 93.00M | -34.96M | 192.13M | 419.28M | -59.10M |
| Income Before Tax Ratio | 144.06% | 20.22% | -7.70% | 36.69% | 85.91% | -11.16% |
| Income Tax Expense | -605.00M | 1.00M | 2.48M | 2.19M | 1.97M | 1.89M |
| Net Income | -376.00M | 92.00M | -37.44M | 189.94M | 417.32M | -60.98M |
| Net Income Ratio | 144.06% | 20.00% | -8.25% | 36.27% | 85.51% | -11.52% |
| EPS | -2.19 | 0.13 | -0.05 | 0.28 | 0.61 | -0.09 |
| EPS Diluted | -2.19 | 0.13 | -0.05 | 0.28 | 0.61 | -0.09 |
| Weighted Avg Shares Out | 171.80M | 684.81M | 684.81M | 684.81M | 684.81M | 684.81M |
| Weighted Avg Shares Out (Dil) | 171.80M | 684.81M | 684.81M | 684.81M | 684.81M | 684.81M |

SRH vs KKR Live Score Updates, IPL 2020: Hyderabad bat, Lockie Ferguson included in Kolkata XI

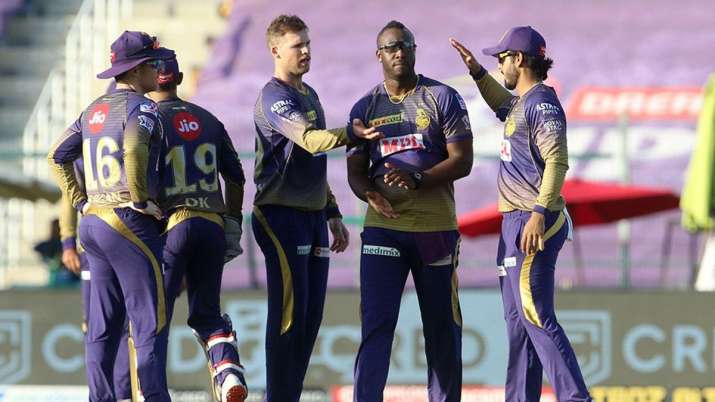
Highlights, IPL 2020: Lockie Ferguson powers KKR to a thrilling win over SRH in Super Over

IPL 2020 | Sunil Narine cleared of suspect bowling action warning list

IPL 2020 Highlights, SRH vs KKR Match Today: Kolkata Knight Riders beat Sunrisers Hyderabad in Super Over

IPL 2020 | Sunrisers Hyderabad vs Kolkata Knight Riders - Statistical Preview

Explained: Why Dinesh Karthik stepped down in the middle of the IPL 2020 season

Fmr LLC Sells 32,836 Shares of FS KKR Capital Corp (NYSE:FSK)

Bank of America Corp DE Buys 6,886 Shares of FS Bancorp Inc (NASDAQ:FSBW)

IPL 2020 | Sunrisers meet Knight Riders as race for top-4 spots heats up
Source: https://incomestatements.info
Category: Stock Reports

