See more : HyperBlock Inc. (HYBOF) Income Statement Analysis – Financial Results
Complete financial analysis of Formula One Group (FWONA) income statement, including revenue, profit margins, EPS and key performance metrics. Get detailed insights into the financial performance of Formula One Group, a leading company in the Entertainment industry within the Communication Services sector.
- Rhinomed Limited (RHNMF) Income Statement Analysis – Financial Results
- Hanwha Aerospace Co., Ltd. (012450.KS) Income Statement Analysis – Financial Results
- Méliuz S.A. (CASH3.SA) Income Statement Analysis – Financial Results
- MERLIN Properties SOCIMI, S.A. (MRPRF) Income Statement Analysis – Financial Results
- Telefônica Brasil S.A. (VIV) Income Statement Analysis – Financial Results
Formula One Group (FWONA)
Industry: Entertainment
Sector: Communication Services
Website: https://www.libertymedia.com/companies/formula-one-group.html
About Formula One Group
Formula One Group engages in the motorsports business in the United States and internationally. It holds commercial rights for the world championship, approximately a nine-month long motor race-based competition in which teams compete for the constructors' championship and drivers compete for the drivers' championship. The company was founded in 1950 and is based in Englewood, Colorado. Formula One Group is a subsidiary of Liberty Media Corporation.
| Metric | 2023 | 2022 | 2021 | 2020 | 2019 | 2018 | 2017 | 2016 | 2015 | 2014 | 2013 | 2012 | 2011 | 2010 |
|---|---|---|---|---|---|---|---|---|---|---|---|---|---|---|
| Revenue | 3.22B | 2.57B | 2.14B | 1.15B | 2.02B | 1.83B | 1.78B | 0.00 | 4.80B | 4.45B | 4.00B | 2.00B | 1.41B | 2.05B |
| Cost of Revenue | 2.24B | 1.75B | 1.49B | 974.00M | 1.39B | 1.27B | 1.22B | 10.00M | 2.72B | 2.07B | 1.83B | 1,631.45B | 0.00 | 0.00 |
| Gross Profit | 982.00M | 823.00M | 647.00M | 171.00M | 628.00M | 554.00M | 564.00M | -10.00M | 2.08B | 2.38B | 2.18B | -1,629.45B | 1.41B | 2.05B |
| Gross Profit Ratio | 30.48% | 31.99% | 30.29% | 14.93% | 31.06% | 30.32% | 31.63% | 0.00% | 43.32% | 53.42% | 54.40% | -81,513.41% | 100.00% | 100.00% |
| Research & Development | 0.00 | 0.00 | 0.00 | 0.00 | 0.00 | 0.00 | 0.00 | 0.00 | 0.00 | 48.84M | 0.00 | 48.84B | 0.00 | 0.00 |
| General & Administrative | 0.00 | 0.00 | 0.00 | 0.00 | 0.00 | 0.00 | 0.00 | 0.00 | 0.00 | 261.91M | 0.00 | 261.91B | 0.00 | 0.00 |
| Selling & Marketing | 0.00 | 0.00 | 0.00 | 174.00M | 210.00M | 204.00M | 199.00M | 58.00M | 72.00M | 873.00M | 764.00M | 248.91B | 151.00M | 0.00 |
| SG&A | 316.00M | 288.00M | 210.00M | 174.00M | 210.00M | 204.00M | 199.00M | 58.00M | 72.00M | 873.00M | 764.00M | 414.00M | 151.00M | 525.00M |
| Other Expenses | 369.00M | 362.00M | 397.00M | 441.00M | 453.00M | 18.00M | 16.00M | 21.00M | 12.00M | -77.00M | 7.86B | 41.00M | 9.00M | 10.00M |
| Operating Expenses | 685.00M | 650.00M | 607.00M | 615.00M | 663.00M | 664.00M | 604.00M | 68.00M | 81.00M | 1.54B | 1.36B | 1.67B | 878.00M | 1.90B |
| Cost & Expenses | 2.93B | 2.40B | 2.10B | 1.59B | 2.06B | 1.94B | 1.82B | 68.00M | 81.00M | 3.61B | 3.19B | 1.67B | 878.00M | 1.90B |
| Interest Income | 0.00 | 149.00M | 123.00M | 7.00M | 195.00M | 0.00 | 0.00 | 0.00 | 0.00 | 716.00K | 0.00 | 716.00M | 0.00 | 0.00 |
| Interest Expense | 214.00M | 149.00M | 123.00M | 146.00M | 195.00M | 192.00M | 220.00M | 19.00M | 20.00M | 255.00M | 132.00M | 33.00M | 16.00M | 65.00M |
| Depreciation & Amortization | 369.00M | 362.00M | 397.00M | 441.00M | 453.00M | 460.00M | 405.00M | 10.00M | 9.00M | 359.00M | 315.00M | 817.00M | 53.00M | 823.00M |
| EBITDA | 794.00M | 535.00M | 363.00M | -119.00M | 247.00M | 452.00M | 321.00M | -58.00M | -72.00M | -100.00M | 9.30B | 2.86B | 827.00M | 1.31B |
| EBITDA Ratio | 24.64% | 23.05% | 22.19% | -7.07% | 23.49% | 21.07% | 21.20% | 0.00% | -2.25% | 22.70% | 223.89% | 126.56% | 48.26% | 43.02% |
| Operating Income | 297.00M | 231.00M | 77.00M | -444.00M | 22.00M | -110.00M | -40.00M | 443.00M | -81.00M | 841.00M | 814.00M | 326.00M | 531.00M | 195.00M |
| Operating Income Ratio | 9.22% | 8.98% | 3.60% | -38.78% | 1.09% | -6.02% | -2.24% | 0.00% | -1.69% | 18.90% | 20.34% | 16.31% | 37.69% | 9.51% |
| Total Other Income/Expenses | -86.00M | 78.00M | -197.00M | -262.00M | -366.00M | -90.00M | -264.00M | 57.00M | 265.00M | 577.00M | 8.04B | 1.69B | 227.00M | 231.00M |
| Income Before Tax | 211.00M | 251.00M | -157.00M | -706.00M | -401.00M | -200.00M | -304.00M | 500.00M | -277.00M | 461.00M | 8.86B | 2.01B | 758.00M | 426.00M |
| Income Before Tax Ratio | 6.55% | 9.76% | -7.35% | -61.66% | -19.83% | -10.95% | -17.05% | 0.00% | -5.78% | 10.36% | 221.29% | 100.65% | 53.80% | 20.78% |
| Income Tax Expense | 27.00M | -311.00M | -37.00M | -112.00M | -90.00M | -50.00M | -561.00M | 171.00M | -102.00M | 66.00M | -135.00M | 600.00M | 165.00M | -571.00M |
| Net Income | 185.00M | 558.00M | -120.00M | -594.00M | -311.00M | -150.00M | 255.00M | 329.00M | -175.00M | 178.00M | 8.78B | 1.41B | 836.00M | 1.00B |
| Net Income Ratio | 5.74% | 21.69% | -5.62% | -51.88% | -15.38% | -8.21% | 14.30% | 0.00% | -3.65% | 4.00% | 219.39% | 70.74% | 59.33% | 48.78% |
| EPS | 0.63 | 2.39 | -0.52 | -2.56 | -1.35 | -0.65 | 1.23 | 3.93 | -0.38 | -0.06 | 17.37 | 8.20 | 4.85 | 5.80 |
| EPS Diluted | 0.62 | 2.15 | -0.52 | -2.56 | -1.35 | -0.65 | 1.21 | 3.93 | -0.38 | -0.06 | 17.18 | 8.20 | 4.85 | 5.80 |
| Weighted Avg Shares Out | 234.00M | 233.00M | 232.00M | 232.00M | 231.00M | 231.00M | 207.00M | 83.80M | 463.02M | 475.38M | 505.52M | 172.49M | 172.49M | 172.49M |
| Weighted Avg Shares Out (Dil) | 240.00M | 244.00M | 232.00M | 232.00M | 231.00M | 232.00M | 211.00M | 83.80M | 463.02M | 475.38M | 511.21M | 172.49M | 172.49M | 172.49M |
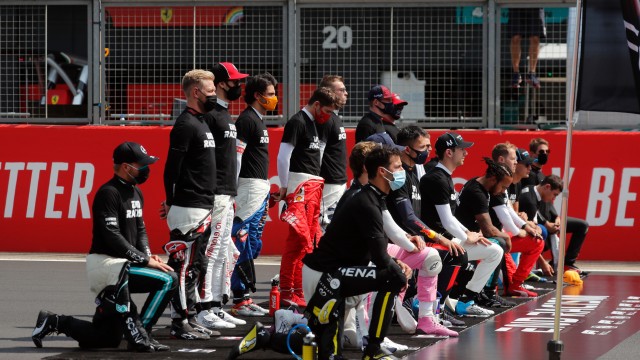
Formula 1: The FIA clarifies free speech rule after fierce backlash from Lewis Hamilton and drivers

Liberty Media Corporation Announces Fourth Quarter Earnings Release and Conference Call

Liberty Media Corporation (FWONA) Q3 2022 Earnings Call Transcript

Liberty Media Corporation Reports Third Quarter 2022 Financial Results
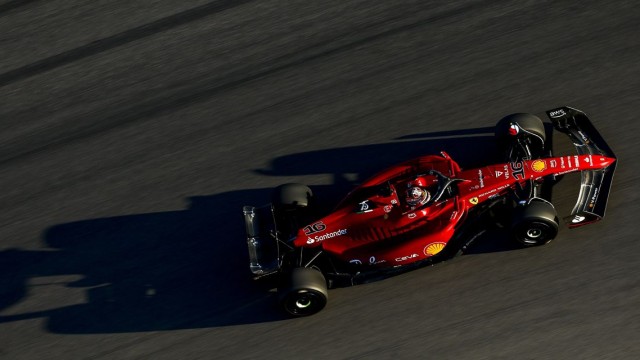
ESPN, Formula One Reach New Broadcast Agreement
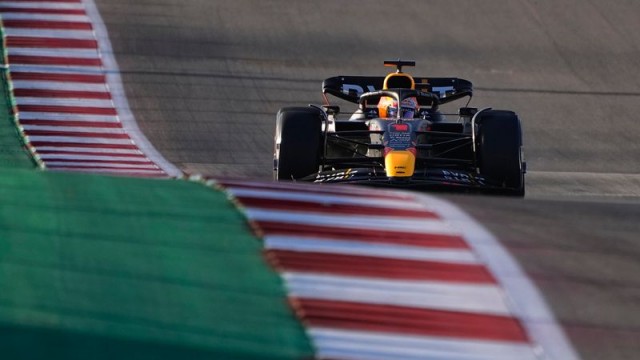
ESPN and F1 announce new US broadcast deal through 2025
Formula One and Walt Disney extend ESPN deal until 2025

This outperforming fund manager looks for four traits in stocks — and has found them in these nine companies

Liberty Media Corporation Reports Second Quarter 2022 Financial Results

Formula 1 Could Secure Lucrative Media Rights Deal. Investors May Be Wanting More.
Source: https://incomestatements.info
Category: Stock Reports
