See more : Daikoku Denki Co., Ltd. (6430.T) Income Statement Analysis – Financial Results
Complete financial analysis of Formula One Group (FWONK) income statement, including revenue, profit margins, EPS and key performance metrics. Get detailed insights into the financial performance of Formula One Group, a leading company in the Entertainment industry within the Communication Services sector.
- The SPAR Group Ltd (SGPPF) Income Statement Analysis – Financial Results
- Ferroamp AB (publ) (FERRO.ST) Income Statement Analysis – Financial Results
- SkyWest, Inc. (SKYW) Income Statement Analysis – Financial Results
- Andiamo Corporation (ANDI) Income Statement Analysis – Financial Results
- Farmacias Benavides, S.A.B. de C.V. (BEVIDESB.MX) Income Statement Analysis – Financial Results
Formula One Group (FWONK)
Industry: Entertainment
Sector: Communication Services
Website: https://www.libertymedia.com/companies/formula-one-group.html
About Formula One Group
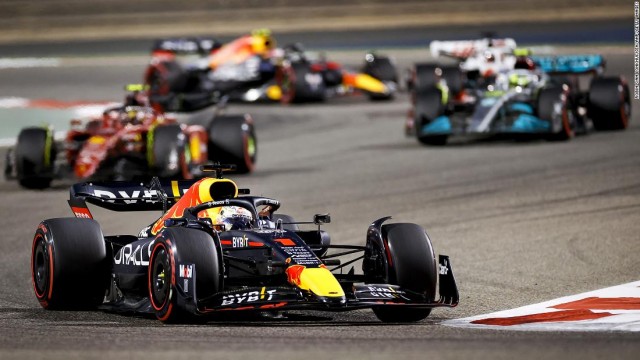
Formula One Group engages in the motorsports business in the United States and internationally. It holds commercial rights for the world championship, approximately a nine-month long motor race-based competition in which teams compete for the constructors' championship and drivers compete for the drivers' championship. The company was founded in 1950 and is based in Englewood, Colorado. Formula One Group is a subsidiary of Liberty Media Corporation.
| Metric | 2023 | 2022 | 2021 | 2020 | 2019 | 2018 | 2017 | 2016 | 2015 | 2014 | 2013 | 2012 | 2011 | 2010 |
|---|---|---|---|---|---|---|---|---|---|---|---|---|---|---|
| Revenue | 3.22B | 2.57B | 2.14B | 1.15B | 2.02B | 1.83B | 1.78B | 0.00 | 4.80B | 4.45B | 4.00B | 2.00B | 1.41B | 2.05B |
| Cost of Revenue | 2.24B | 1.75B | 1.49B | 974.00M | 1.39B | 1.27B | 1.22B | 10.00M | 2.72B | 2.07B | 1.83B | 1,631.45B | 0.00 | 0.00 |
| Gross Profit | 982.00M | 823.00M | 647.00M | 171.00M | 628.00M | 554.00M | 564.00M | -10.00M | 2.08B | 2.38B | 2.18B | -1,629.45B | 1.41B | 2.05B |
| Gross Profit Ratio | 30.48% | 31.99% | 30.29% | 14.93% | 31.06% | 30.32% | 31.63% | 0.00% | 43.32% | 53.42% | 54.40% | -81,513.41% | 100.00% | 100.00% |
| Research & Development | 0.00 | 0.00 | 0.00 | 0.00 | 0.00 | 0.00 | 0.00 | 0.00 | 0.00 | 48.84M | 0.00 | 48.84B | 0.00 | 0.00 |
| General & Administrative | 0.00 | 0.00 | 0.00 | 0.00 | 0.00 | 0.00 | 0.00 | 0.00 | 0.00 | 261.91M | 0.00 | 261.91B | 0.00 | 0.00 |
| Selling & Marketing | 0.00 | 0.00 | 0.00 | 174.00M | 210.00M | 204.00M | 199.00M | 58.00M | 72.00M | 873.00M | 764.00M | 248.91B | 151.00M | 0.00 |
| SG&A | 316.00M | 288.00M | 210.00M | 174.00M | 210.00M | 204.00M | 199.00M | 58.00M | 72.00M | 873.00M | 764.00M | 414.00M | 151.00M | 525.00M |
| Other Expenses | 369.00M | 362.00M | 397.00M | 441.00M | 453.00M | 18.00M | 16.00M | 21.00M | 12.00M | -77.00M | 7.86B | 41.00M | 9.00M | 10.00M |
| Operating Expenses | 685.00M | 650.00M | 607.00M | 615.00M | 663.00M | 664.00M | 604.00M | 68.00M | 81.00M | 1.54B | 1.36B | 1.67B | 878.00M | 1.90B |
| Cost & Expenses | 2.93B | 2.40B | 2.10B | 1.59B | 2.06B | 1.94B | 1.82B | 68.00M | 81.00M | 3.61B | 3.19B | 1.67B | 878.00M | 1.90B |
| Interest Income | 0.00 | 149.00M | 123.00M | 7.00M | 195.00M | 0.00 | 0.00 | 0.00 | 0.00 | 716.00K | 0.00 | 716.00M | 0.00 | 0.00 |
| Interest Expense | 214.00M | 149.00M | 123.00M | 146.00M | 195.00M | 192.00M | 220.00M | 19.00M | 20.00M | 255.00M | 132.00M | 33.00M | 16.00M | 65.00M |
| Depreciation & Amortization | 369.00M | 362.00M | 397.00M | 441.00M | 453.00M | 460.00M | 405.00M | 10.00M | 9.00M | 359.00M | 315.00M | 817.00M | 53.00M | 823.00M |
| EBITDA | 794.00M | 535.00M | 363.00M | -119.00M | 247.00M | 452.00M | 321.00M | -58.00M | -72.00M | -100.00M | 9.30B | 2.86B | 827.00M | 1.31B |
| EBITDA Ratio | 24.64% | 23.05% | 22.19% | -7.07% | 23.49% | 21.07% | 21.20% | 0.00% | -2.25% | 22.70% | 223.89% | 126.56% | 48.26% | 43.02% |
| Operating Income | 297.00M | 231.00M | 77.00M | -444.00M | 22.00M | -110.00M | -40.00M | 443.00M | -81.00M | 841.00M | 814.00M | 326.00M | 531.00M | 195.00M |
| Operating Income Ratio | 9.22% | 8.98% | 3.60% | -38.78% | 1.09% | -6.02% | -2.24% | 0.00% | -1.69% | 18.90% | 20.34% | 16.31% | 37.69% | 9.51% |
| Total Other Income/Expenses | -86.00M | 78.00M | -197.00M | -262.00M | -366.00M | -90.00M | -264.00M | 57.00M | 265.00M | 577.00M | 8.04B | 1.69B | 227.00M | 231.00M |
| Income Before Tax | 211.00M | 251.00M | -157.00M | -706.00M | -401.00M | -200.00M | -304.00M | 500.00M | -277.00M | 461.00M | 8.86B | 2.01B | 758.00M | 426.00M |
| Income Before Tax Ratio | 6.55% | 9.76% | -7.35% | -61.66% | -19.83% | -10.95% | -17.05% | 0.00% | -5.78% | 10.36% | 221.29% | 100.65% | 53.80% | 20.78% |
| Income Tax Expense | 27.00M | -311.00M | -37.00M | -112.00M | -90.00M | -50.00M | -561.00M | 171.00M | -102.00M | 66.00M | -135.00M | 600.00M | 165.00M | -571.00M |
| Net Income | 185.00M | 558.00M | -120.00M | -594.00M | -311.00M | -150.00M | 255.00M | 329.00M | -175.00M | 178.00M | 8.78B | 1.41B | 836.00M | 1.00B |
| Net Income Ratio | 5.74% | 21.69% | -5.62% | -51.88% | -15.38% | -8.21% | 14.30% | 0.00% | -3.65% | 4.00% | 219.39% | 70.74% | 59.33% | 48.78% |
| EPS | 0.63 | 2.39 | -0.52 | -2.56 | -1.35 | -0.65 | 1.23 | 3.93 | -0.38 | -0.06 | 17.37 | 8.20 | 4.85 | 5.80 |
| EPS Diluted | 0.62 | 2.15 | -0.52 | -2.56 | -1.35 | -0.65 | 1.21 | 3.93 | -0.38 | -0.06 | 17.18 | 8.20 | 4.85 | 5.80 |
| Weighted Avg Shares Out | 234.00M | 233.00M | 232.00M | 232.00M | 231.00M | 231.00M | 207.00M | 83.80M | 463.02M | 475.38M | 505.52M | 172.49M | 172.49M | 172.49M |
| Weighted Avg Shares Out (Dil) | 240.00M | 244.00M | 232.00M | 232.00M | 231.00M | 232.00M | 211.00M | 83.80M | 463.02M | 475.38M | 511.21M | 172.49M | 172.49M | 172.49M |

Has Liberty Media (FWONK) Outpaced Other Consumer Discretionary Stocks This Year?

Formula 1 stock zooms higher on nascent US fandom

Sports fanatics should consider buying these three stocks, Jim Cramer says

Liberty Media (FWONK) May Report Negative Earnings: Know the Trend Ahead of Next Week's Release

Formula One Group: Drive To Survive

Liberty Media (FWONK) Moves to Strong Buy: Rationale Behind the Upgrade

Liberty Media (FWONK) Q2 Earnings and Revenues Beat Estimates

Why Earnings Season Could Be Great for Liberty Media (FWONK)

Liberty Media (FWONK) Expected to Beat Earnings Estimates: Can the Stock Move Higher?

Liberty Media (FWONK) Reports Q1 Loss, Tops Revenue Estimates
Source: https://incomestatements.info
Category: Stock Reports
