See more : Illumina, Inc. (ILU.DE) Income Statement Analysis – Financial Results
Complete financial analysis of Forward Pharma A/S (FWP) income statement, including revenue, profit margins, EPS and key performance metrics. Get detailed insights into the financial performance of Forward Pharma A/S, a leading company in the Biotechnology industry within the Healthcare sector.
- Türk Telekomünikasyon Anonim Sirketi (TRKNF) Income Statement Analysis – Financial Results
- Tradia Corporation (9365.T) Income Statement Analysis – Financial Results
- Blue Star Global, Inc. (BUSC) Income Statement Analysis – Financial Results
- Neo Infracon Limited (NEOINFRA.BO) Income Statement Analysis – Financial Results
- Global Self Storage, Inc. (SELF) Income Statement Analysis – Financial Results
Forward Pharma A/S (FWP)
About Forward Pharma A/S
Forward Pharma A/S does not have significant operations. Previously, it operated as a biopharmaceutical company that focused on developing FP187 proprietary formulation of dimethyl fumarate for the treatment of inflammatory and neurological indications. Forward Pharma A/S was incorporated in 2005 and is headquartered in Copenhagen, Denmark.
| Metric | 2021 | 2020 | 2019 | 2018 | 2017 | 2016 | 2015 | 2014 | 2013 | 2012 |
|---|---|---|---|---|---|---|---|---|---|---|
| Revenue | -188.00K | 0.00 | 0.00 | 0.00 | 1.25B | 0.00 | 0.00 | 0.00 | 0.00 | 0.00 |
| Cost of Revenue | 0.00 | 0.00 | 0.00 | 0.00 | 25.00M | 0.00 | 0.00 | 0.00 | 0.00 | 0.00 |
| Gross Profit | -188.00K | 0.00 | 0.00 | 0.00 | 1.23B | 0.00 | 0.00 | 0.00 | 0.00 | 0.00 |
| Gross Profit Ratio | 100.00% | 0.00% | 0.00% | 0.00% | 98.00% | 0.00% | 0.00% | 0.00% | 0.00% | 0.00% |
| Research & Development | 226.00K | 327.00K | 1.05M | 2.75M | 20.50M | 41.05M | 33.73M | 10.55M | 8.02M | 4.45M |
| General & Administrative | 3.65M | 3.06M | 4.23M | 9.54M | 17.11M | 14.38M | 15.85M | 9.15M | 1.01M | 928.00K |
| Selling & Marketing | 0.00 | 0.00 | 0.00 | 0.00 | 0.00 | 0.00 | 0.00 | 0.00 | 0.00 | 0.00 |
| SG&A | 3.65M | 3.06M | 4.23M | 9.54M | 17.11M | 14.38M | 15.85M | 9.15M | 1.01M | 928.00K |
| Other Expenses | 0.00 | 0.00 | 0.00 | 0.00 | 0.00 | 0.00 | 0.00 | 0.00 | 0.00 | 0.00 |
| Operating Expenses | 3.87M | 3.39M | 5.28M | 12.28M | 37.60M | 55.43M | 49.58M | 19.70M | 9.03M | 5.37M |
| Cost & Expenses | 3.87M | 3.39M | 5.28M | 12.28M | 62.60M | 55.43M | 49.58M | 19.70M | 9.03M | 5.37M |
| Interest Income | 0.00 | 0.00 | 0.00 | 0.00 | 227.00K | 389.00K | 438.00K | 63.00K | 0.00 | 0.00 |
| Interest Expense | -1.98M | 0.00 | 0.00 | 0.00 | 0.00 | 0.00 | 0.00 | 416.00K | 75.00K | 32.00K |
| Depreciation & Amortization | 1.98M | -3.06M | 1.00K | 4.00K | 227.00K | 109.00K | 37.00K | 3.00K | 4.00K | 2.00K |
| EBITDA | -1.89M | -6.45M | -4.22M | -8.92M | 1.18B | -54.43M | -37.30M | -18.85M | -15.71M | -22.45M |
| EBITDA Ratio | 1,006.38% | 0.00% | 0.00% | 0.00% | 94.78% | 0.00% | 0.00% | 0.00% | 0.00% | 0.00% |
| Operating Income | -3.87M | -3.39M | -5.28M | -12.28M | 1.19B | -55.43M | -49.58M | -19.70M | -9.03M | -5.37M |
| Operating Income Ratio | 2,060.64% | 0.00% | 0.00% | 0.00% | 94.99% | 0.00% | 0.00% | 0.00% | 0.00% | 0.00% |
| Total Other Income/Expenses | 1.98M | -3.06M | 1.06M | 3.36M | -2.91M | 895.00K | 12.24M | 435.00K | -6.76M | -17.11M |
| Income Before Tax | -1.89M | -6.45M | -4.22M | -8.93M | 1.18B | -54.54M | -37.34M | -19.27M | -15.79M | -22.48M |
| Income Before Tax Ratio | 1,006.38% | 0.00% | 0.00% | 0.00% | 94.76% | 0.00% | 0.00% | 0.00% | 0.00% | 0.00% |
| Income Tax Expense | -1.98M | 0.00 | 1.06M | -204.00K | 267.40M | -21.20M | -336.00K | -250.00K | -96.00K | -17.07M |
| Net Income | 90.00K | -6.45M | -4.22M | -8.72M | 917.09M | -33.34M | -37.00M | -19.02M | -15.70M | -22.48M |
| Net Income Ratio | -47.87% | 0.00% | 0.00% | 0.00% | 73.37% | 0.00% | 0.00% | 0.00% | 0.00% | 0.00% |
| EPS | 0.01 | -0.94 | -0.62 | -1.29 | 33.78 | -4.96 | -5.54 | -3.86 | -2.40 | -3.43 |
| EPS Diluted | 0.01 | -0.94 | -0.62 | -1.29 | 32.18 | -4.96 | -5.54 | -3.86 | -2.40 | -3.43 |
| Weighted Avg Shares Out | 6.98M | 6.86M | 6.79M | 6.76M | 27.15M | 6.72M | 6.68M | 4.93M | 6.54M | 6.54M |
| Weighted Avg Shares Out (Dil) | 6.98M | 6.86M | 6.79M | 6.76M | 28.50M | 6.72M | 6.68M | 4.93M | 6.54M | 6.54M |

Genmab A/S (NASDAQ:GMAB) Hits New 1-Year High at $38.79

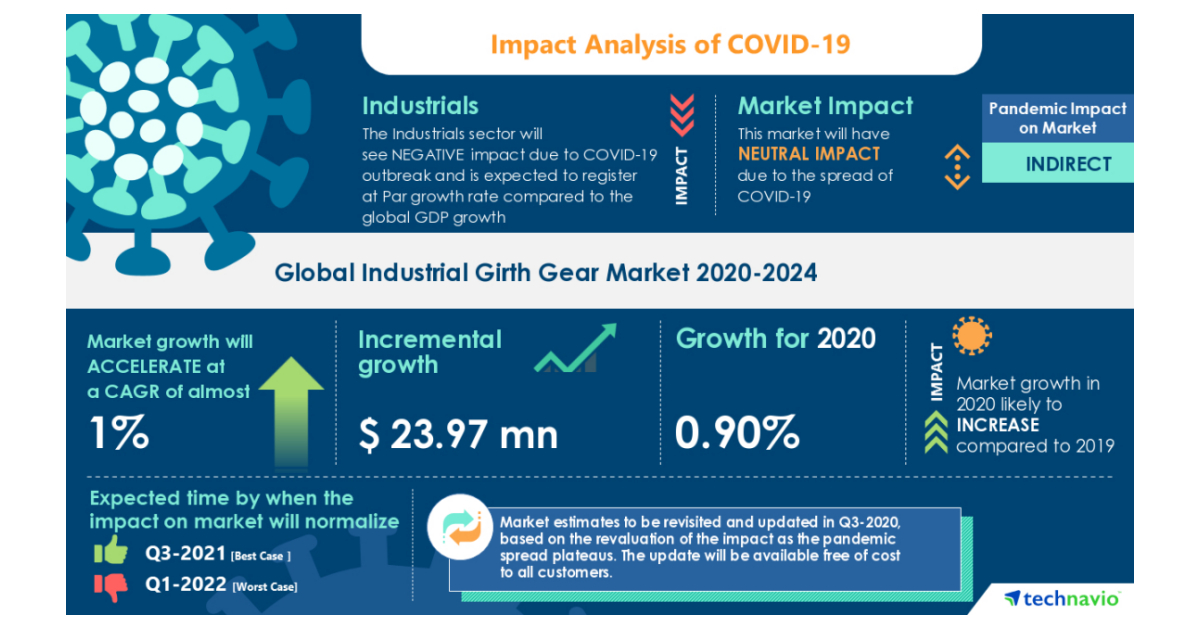
Global Industrial Girth Gear Market Analysis Highlights the Impact of COVID-19 2020-2024| Improvement in Girth Gear Manufacturing Technologies to Boost Market Growth | Technavio

Rockwell Automation Holding Up On Recovery And Reshoring Expectations (NYSE:ROK)

Altra Industrial Motion Corp (AIMC) Q2 2020 Earnings Call Transcript | The Motley Fool

Delingpole: Churchill Was Racist? Wait Till They Hear About Who He Beat

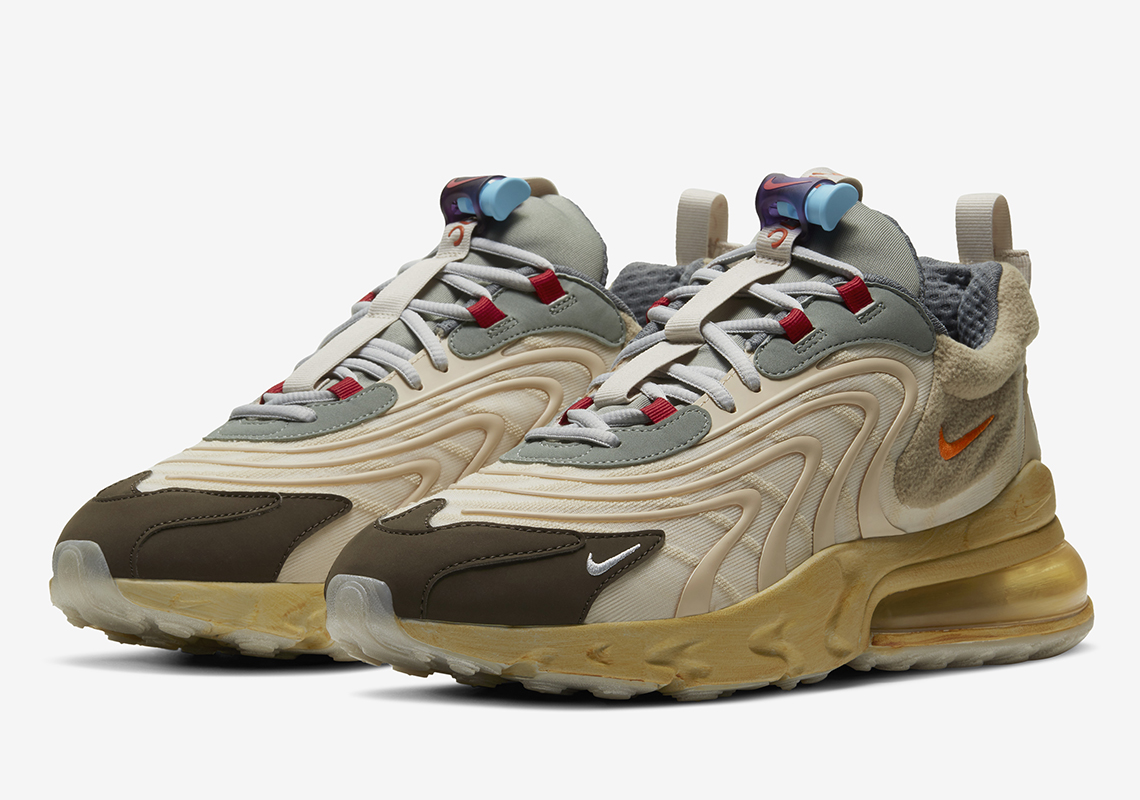
Travis Scott Nike Air Max 270 Cactus Trails Store List | SneakerNews.com

Denmark stocks higher at close of trade; OMX Copenhagen 20 up 1.00%
Source: https://incomestatements.info
Category: Stock Reports


