See more : Avex Inc. (7860.T) Income Statement Analysis – Financial Results
Complete financial analysis of GFL Environmental Inc. (GFL) income statement, including revenue, profit margins, EPS and key performance metrics. Get detailed insights into the financial performance of GFL Environmental Inc., a leading company in the Waste Management industry within the Industrials sector.
- Harford Bank (HFBK) Income Statement Analysis – Financial Results
- Credit Bank of Moscow (public joint-stock company) (CBOM.ME) Income Statement Analysis – Financial Results
- Jiangsu Boamax Technologies Group Co., Ltd. (002514.SZ) Income Statement Analysis – Financial Results
- Som Datt Finance Corporation Limited (SODFC.BO) Income Statement Analysis – Financial Results
- Middlesex Water Company (MSEX) Income Statement Analysis – Financial Results
GFL Environmental Inc. (GFL)
About GFL Environmental Inc.
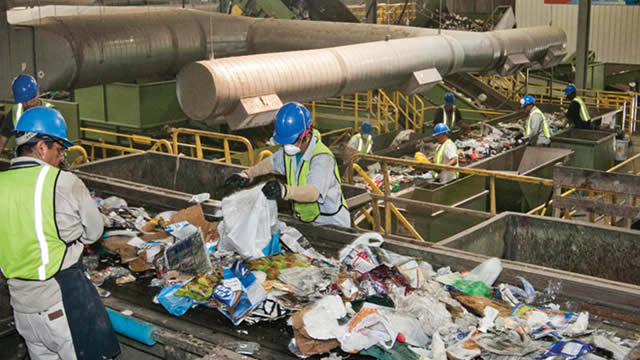
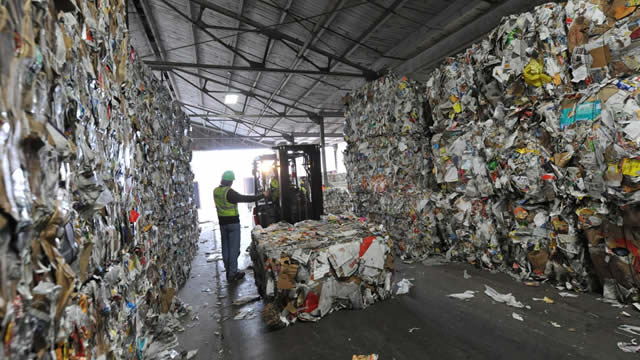
GFL Environmental Inc. operates as a diversified environmental services company in Canada and the United States. The company offers non-hazardous solid waste management, infrastructure and soil remediation, and liquid waste management services. Its solid waste management business line includes the collection, transportation, transfer, recycling, and disposal of non-hazardous solid waste for municipal, residential, and commercial and industrial customers. The company's infrastructure and soil remediation business line provides remediation of contaminated soils, as well as complementary services, including civil, demolition, and excavation and shoring services. Its liquid waste management business collects, manages, transports, processes, and disposes of a range of industrial and commercial liquid wastes, as well as resells liquid waste products. The company was incorporated in 2007 and is headquartered in Vaughan, Canada.
| Metric | 2023 | 2022 | 2021 | 2020 | 2019 | 2018 | 2017 | 2016 |
|---|---|---|---|---|---|---|---|---|
| Revenue | 7.52B | 6.76B | 5.53B | 4.20B | 3.35B | 1.85B | 1.33B | 933.66M |
| Cost of Revenue | 6.23B | 5.96B | 5.00B | 4.01B | 3.07B | 1.70B | 1.15B | 644.35M |
| Gross Profit | 1.28B | 797.60M | 527.60M | 190.10M | 273.75M | 149.10M | 188.00M | 289.31M |
| Gross Profit Ratio | 17.09% | 11.80% | 9.55% | 4.53% | 8.18% | 8.05% | 14.10% | 30.99% |
| Research & Development | 0.00 | 0.00 | 0.00 | 0.00 | 0.00 | 0.00 | 0.00 | 0.00 |
| General & Administrative | 0.00 | 0.00 | 0.00 | 508.40M | 396.50M | 0.00 | 157.09M | 120.62M |
| Selling & Marketing | 0.00 | 0.00 | 0.00 | 0.00 | 0.00 | 0.00 | 0.00 | 0.00 |
| SG&A | 895.50M | 730.40M | 591.90M | 508.40M | 396.50M | 344.16M | 157.09M | 120.62M |
| Other Expenses | 0.00 | 0.00 | -49.30M | -2.00M | -2.00M | 0.00 | 17.40M | -2.00M |
| Operating Expenses | 1.27B | 730.40M | 591.90M | 508.40M | 396.50M | 344.16M | 157.09M | 298.18M |
| Cost & Expenses | 7.13B | 6.69B | 5.59B | 4.51B | 3.47B | 2.05B | 1.30B | 942.53M |
| Interest Income | 0.00 | 440.90M | 345.60M | 408.50M | 482.40M | 262.00M | 0.00 | 0.00 |
| Interest Expense | 584.10M | 489.30M | 434.10M | 597.60M | 532.22M | 0.00 | 212.68M | 179.03M |
| Depreciation & Amortization | 1.49B | 1.53B | 1.39B | 1.24B | 799.46M | 412.93M | 239.07M | 177.57M |
| EBITDA | 2.21B | 1.63B | 1.09B | 303.80M | 674.71M | 158.32M | 311.80M | 154.93M |
| EBITDA Ratio | 29.47% | 23.86% | 24.05% | 21.86% | 20.16% | 11.76% | 21.56% | 17.85% |
| Operating Income | 389.20M | 87.90M | -64.30M | -320.30M | -124.75M | -195.06M | 48.31M | -10.87M |
| Operating Income Ratio | 5.18% | 1.30% | -1.16% | -7.63% | -3.73% | -10.53% | 3.62% | -1.16% |
| Total Other Income/Expenses | -197.10M | -507.30M | -671.90M | -1.04B | -484.47M | -429.19M | -202.37M | -192.79M |
| Income Before Tax | 192.10M | -359.30M | -712.80M | -1.36B | -609.22M | -624.25M | -139.96M | -201.66M |
| Income Before Tax Ratio | 2.56% | -5.31% | -12.90% | -32.31% | -18.20% | -33.70% | -10.50% | -21.60% |
| Income Tax Expense | 159.90M | -176.10M | -106.00M | -360.90M | -157.57M | -140.92M | -38.98M | -49.45M |
| Net Income | 45.40M | -183.20M | -606.80M | -994.90M | -451.65M | -483.34M | -100.98M | -152.21M |
| Net Income Ratio | 0.60% | -2.71% | -10.98% | -23.71% | -13.49% | -26.09% | -7.58% | -16.30% |
| EPS | -0.13 | -0.50 | -1.68 | -2.76 | -1.44 | -1.54 | -0.32 | -0.48 |
| EPS Diluted | -0.13 | -0.50 | -1.68 | -2.76 | -1.44 | -1.54 | -0.31 | -0.48 |
| Weighted Avg Shares Out | 349.23M | 367.17M | 361.57M | 360.38M | 314.05M | 314.05M | 314.05M | 314.05M |
| Weighted Avg Shares Out (Dil) | 349.23M | 367.17M | 361.57M | 360.38M | 314.05M | 314.05M | 326.42M | 314.05M |

GFL Environmental Inc. Prices Offering of US$210 Million of Tax-Exempt Industrial Revenue Bonds at 4.375%

NB Private Equity Partners Limited: Interim Results

NBPE Announces August Monthly NAV Estimate

GFL Environmental Inc. Announces Proposed Offering of US$210 Million of Tax-Exempt Industrial Revenue Bonds

GFL Environmental Inc. Announces Issuance of 16 million Subordinate Voting Shares on Conversion of Series A Preferred Shares

NBPE Announces July Monthly NAV Estimate

3 Waste Management Stocks That Could Benefit from Circular Economy

GFL Environmental Inc. (GFL) Q2 2024 Earnings Call Transcript

U.S. IPO Weekly Recap: August Kicks Off With One Small Pricing

GFL Environmental Inc. (GFL) Q2 Earnings Beat Estimates
Source: https://incomestatements.info
Category: Stock Reports
