See more : Savosolar Oyj (SAVOS.ST) Income Statement Analysis – Financial Results
Complete financial analysis of General Finance Corporation (GFNCP) income statement, including revenue, profit margins, EPS and key performance metrics. Get detailed insights into the financial performance of General Finance Corporation, a leading company in the Rental & Leasing Services industry within the Industrials sector.
- Drägerwerk AG & Co. KGaA (DRWKF) Income Statement Analysis – Financial Results
- Biocure Technology Inc. (CURE.CN) Income Statement Analysis – Financial Results
- SUNeVision Holdings Ltd. (1686.HK) Income Statement Analysis – Financial Results
- Ajax I (AJAX) Income Statement Analysis – Financial Results
- MGM China Holdings Limited (2282.HK) Income Statement Analysis – Financial Results
General Finance Corporation (GFNCP)
About General Finance Corporation
General Finance Corporation, a specialty rental services company, provides portable storage, modular space, and liquid containment solutions in North America and the Asia-Pacific regions. The company's portable storage products include storage containers for classroom equipment storage, construction equipment and tool storage, disaster shelters, landscaping sheds, recreational equipment storage, and retail inventory storage applications; and freight containers used in freight transportation. Its modular space products comprise office or portable building containers, ground level offices, and modular buildings and offices for use in general administrative office spaces, military installations, workforce living accommodations, bank branches, classrooms/education, construction offices, day-care facilities, dormitories, general administrative office space, healthcare and rental facilities, retail space, and shelters. The company's liquid containment products consist of portable liquid storage tanks for well-site liquid containment needs, expansion/upgrade projects, highway construction/groundwater sewage, infrastructure projects, major industrial projects, mining pit pump works, municipal sewer and water projects, non-residential construction projects, pipeline construction and maintenance, and refinery turnarounds. It also provides steps, ramps, furniture, portable toilets, security systems, shelving, mud pumps, hoses, splitter valves, tee connectors, and other items used in connection with leased equipment. In addition, the company offers temporary prison holding cells, hoarding units, blast-resistant units, workforce living accommodations, temporary retail frontage units, and observatory units customized from storage containers, as well as shipping container modifications, specialty trailers and tanks, chassis, storm shelters, and trash hoppers. The company was founded in 2005 and is headquartered in Pasadena, California.
| Metric | 2020 | 2019 | 2018 | 2017 | 2016 | 2015 | 2014 | 2013 | 2012 | 2011 | 2010 | 2009 | 2006 | 2005 |
|---|---|---|---|---|---|---|---|---|---|---|---|---|---|---|
| Revenue | 356.48M | 378.21M | 347.30M | 276.93M | 285.85M | 303.83M | 287.11M | 245.54M | 212.24M | 182.26M | 156.31M | 146.46M | 0.00 | 0.00 |
| Cost of Revenue | 180.37M | 192.95M | 186.19M | 150.86M | 161.88M | 152.45M | 158.08M | 139.82M | 121.20M | 102.75M | 87.81M | 64.32M | 0.00 | 0.00 |
| Gross Profit | 176.11M | 185.26M | 161.11M | 126.07M | 123.97M | 151.38M | 129.02M | 105.72M | 91.04M | 79.51M | 68.50M | 82.14M | 0.00 | 0.00 |
| Gross Profit Ratio | 49.40% | 48.98% | 46.39% | 45.52% | 43.37% | 49.82% | 44.94% | 43.06% | 42.89% | 43.63% | 43.82% | 56.09% | 0.00% | 0.00% |
| Research & Development | 0.00 | 0.00 | 0.00 | 0.00 | 0.00 | 0.00 | 0.00 | 0.00 | 0.00 | 0.00 | 0.00 | 0.00 | 0.00 | 0.00 |
| General & Administrative | 0.00 | 0.00 | 0.00 | 0.00 | 0.00 | 0.00 | 0.00 | 0.00 | 45.87M | 44.71M | 37.67M | 51.04M | 1.17M | 0.00 |
| Selling & Marketing | 0.00 | 81.97M | 77.65M | 67.71M | 68.70M | 70.60M | 62.61M | 54.42M | 0.00 | 0.00 | 0.00 | 0.00 | 0.00 | 0.00 |
| SG&A | 0.00 | 81.97M | 77.65M | 67.71M | 68.70M | 70.60M | 62.61M | 54.42M | 45.87M | 44.71M | 37.67M | 51.04M | 1.17M | 0.00 |
| Other Expenses | 116.50M | 41.70M | 39.76M | 39.30M | 37.82M | 37.73M | 26.37M | 21.81M | 18.92M | 19.17M | 19.62M | 17.05M | 0.00 | -3.51K |
| Operating Expenses | 116.50M | 123.67M | 117.41M | 107.01M | 106.52M | 108.33M | 88.98M | 76.23M | 64.79M | 63.88M | 57.29M | 68.09M | 1.17M | -3.51K |
| Cost & Expenses | 296.87M | 316.62M | 303.60M | 257.86M | 268.40M | 260.78M | 247.06M | 216.05M | 185.99M | 166.63M | 145.10M | 132.40M | 1.17M | 3.51K |
| Interest Income | 0.00 | 0.00 | 0.00 | 0.00 | 0.00 | 0.00 | 0.00 | 0.00 | 0.00 | 0.00 | 0.00 | 0.00 | 0.00 | 0.00 |
| Interest Expense | 26.39M | 35.34M | 33.99M | 19.65M | 19.65M | 21.10M | 11.95M | 10.97M | 12.74M | 20.29M | 15.97M | 16.16M | 0.00 | 0.00 |
| Depreciation & Amortization | 35.55M | 42.11M | 40.34M | 40.09M | 38.63M | 38.57M | 27.13M | 22.24M | 18.92M | 19.17M | 20.00M | 17.30M | 722.00 | 0.00 |
| EBITDA | 76.59M | 75.81M | 65.34M | 56.76M | 50.73M | 75.50M | 58.09M | 45.10M | 39.64M | 26.70M | 23.46M | 25.37M | 697.25K | -3.51K |
| EBITDA Ratio | 21.48% | 20.04% | 18.81% | 20.50% | 17.75% | 24.85% | 20.23% | 18.37% | 18.68% | 14.65% | 15.01% | 17.32% | 0.00% | 0.00% |
| Operating Income | 59.61M | 61.59M | 43.70M | 19.07M | 17.45M | 43.04M | 40.04M | 29.49M | 26.25M | 15.64M | 11.21M | 14.06M | -1.17M | -3.51K |
| Operating Income Ratio | 16.72% | 16.28% | 12.58% | 6.88% | 6.10% | 14.17% | 13.95% | 12.01% | 12.37% | 8.58% | 7.17% | 9.60% | 0.00% | 0.00% |
| Total Other Income/Expenses | -44.97M | -63.24M | -53.49M | -19.94M | -22.93M | -21.30M | -13.27M | -9.88M | -12.14M | -21.54M | -21.43M | -25.18M | 1.87M | 0.00 |
| Income Before Tax | 14.65M | -1.65M | -9.79M | -872.00K | -5.48M | 21.74M | 26.77M | 19.61M | 14.10M | -5.90M | -10.22M | -11.12M | 696.53K | 0.00 |
| Income Before Tax Ratio | 4.11% | -0.44% | -2.82% | -0.31% | -1.92% | 7.16% | 9.32% | 7.99% | 6.64% | -3.24% | -6.54% | -7.59% | 0.00% | 0.00% |
| Income Tax Expense | 6.70M | 5.82M | -679.00K | -25.00K | -2.19M | 8.70M | 11.62M | 8.20M | 5.36M | 2.96M | -1.26M | -4.37M | 239.70K | 3.51K |
| Net Income | 7.95M | -7.47M | -8.31M | -2.96M | -5.36M | 7.13M | 7.39M | 3.70M | 2.61M | -15.72M | -11.25M | -3.72M | 456.83K | -3.51K |
| Net Income Ratio | 2.23% | -1.97% | -2.39% | -1.07% | -1.87% | 2.35% | 2.58% | 1.51% | 1.23% | -8.62% | -7.20% | -2.54% | 0.00% | 0.00% |
| EPS | 0.76 | -0.71 | -0.79 | -0.28 | -0.51 | 0.68 | 0.70 | 0.35 | 0.25 | -1.50 | -1.07 | -0.35 | 0.04 | 0.00 |
| EPS Diluted | 0.76 | -0.71 | -0.79 | -0.28 | -0.51 | 0.68 | 0.70 | 0.35 | 0.25 | -1.50 | -1.07 | -0.35 | 0.04 | 0.00 |
| Weighted Avg Shares Out | 10.50M | 10.50M | 10.50M | 10.50M | 10.50M | 10.50M | 10.50M | 10.50M | 10.50M | 10.50M | 10.50M | 10.50M | 10.50M | 10.50M |
| Weighted Avg Shares Out (Dil) | 10.50M | 10.50M | 10.50M | 10.50M | 10.50M | 10.50M | 10.50M | 10.50M | 10.50M | 10.50M | 10.50M | 10.50M | 10.50M | 10.50M |

General Finance Corporation (GFN) CEO Jody Miller on Q4 2020 Results - Earnings Call Transcript
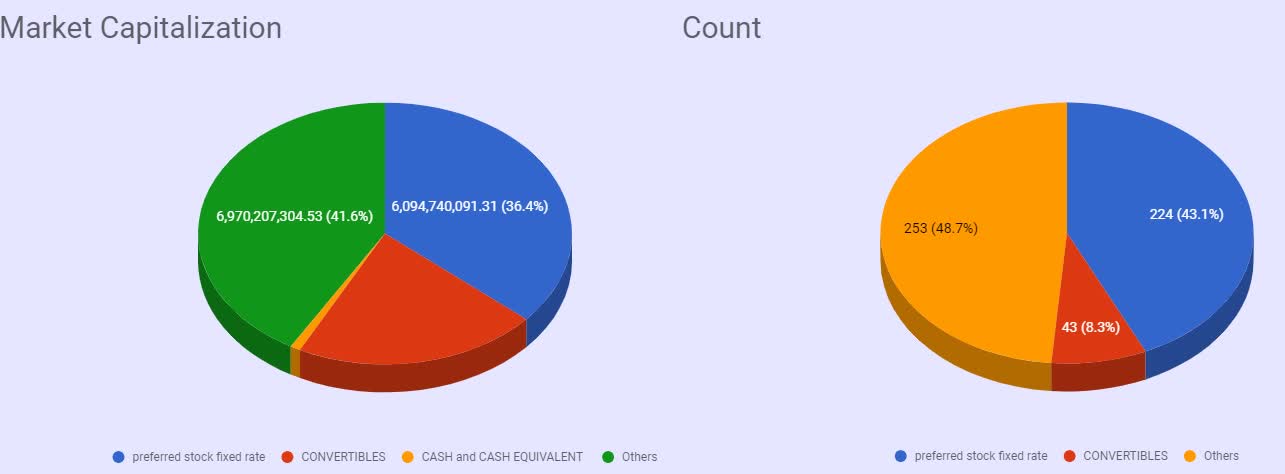
Fixed-Rate Preferred Stocks - Complete Review

Analysts Offer Insights on Financial Companies: WillScot (WSC), Carlyle Group (CG) and Mr Cooper Group (COOP)

Mcgrath Rentcorp (MGRC) Receives a Hold from Oppenheimer

Oppenheimer Keeps a Hold Rating on United Rentals (URI)

CH Robinson (CHRW) Gets a Hold Rating from Oppenheimer

Ecolab (ECL) Gets a Hold Rating from Oppenheimer

Bank of New York Mellon Corp Acquires 1,942 Shares of General Finance Co. (NASDAQ:GFN)

Oppenheimer Keeps Their Buy Rating on Service International (SCI)

Analysts' Opinions Are Mixed on These Services Stocks: Catasys (CATS) and FedEx (FDX)
Source: https://incomestatements.info
Category: Stock Reports
