Complete financial analysis of GLOBALFOUNDRIES Inc. (GFS) income statement, including revenue, profit margins, EPS and key performance metrics. Get detailed insights into the financial performance of GLOBALFOUNDRIES Inc., a leading company in the Semiconductors industry within the Technology sector.
- Mkango Resources Ltd. (MKA.V) Income Statement Analysis – Financial Results
- Elve S.A. (ELBE.AT) Income Statement Analysis – Financial Results
- Chase Packaging Corporation (WHLT) Income Statement Analysis – Financial Results
- Tencent Holdings Limited (TCTZF) Income Statement Analysis – Financial Results
- Public Joint Stock Company SG-Development (HALS.ME) Income Statement Analysis – Financial Results
GLOBALFOUNDRIES Inc. (GFS)
About GLOBALFOUNDRIES Inc.
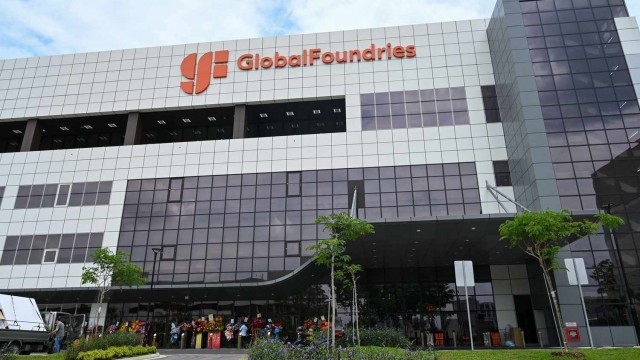
GLOBALFOUNDRIES Inc. operates as a semiconductor foundry worldwide. It manufactures integrated circuits, which enable various electronic devices that are pervasive. The company manufactures a range of semiconductor devices, including microprocessors, mobile application processors, baseband processors, network processors, radio frequency modems, microcontrollers, power management units, and microelectromechanical systems, as well as offers mainstream wafer fabrication services and technologies. The company was founded in 2009 and is based in Malta, New York.
| Metric | 2023 | 2022 | 2021 | 2020 | 2019 | 2018 |
|---|---|---|---|---|---|---|
| Revenue | 7.39B | 8.11B | 6.59B | 4.85B | 5.81B | 6.20B |
| Cost of Revenue | 5.29B | 5.87B | 5.57B | 5.56B | 6.35B | 6.65B |
| Gross Profit | 2.10B | 2.24B | 1.01B | -712.72M | -532.24M | -450.05M |
| Gross Profit Ratio | 28.42% | 27.61% | 15.38% | -14.69% | -9.16% | -7.26% |
| Research & Development | 428.00M | 482.00M | 478.00M | 475.77M | 582.97M | 926.22M |
| General & Administrative | 448.00M | 451.00M | 545.03M | 287.64M | 358.94M | 325.27M |
| Selling & Marketing | 0.00 | 45.00M | 49.97M | 0.00 | 0.00 | 0.00 |
| SG&A | 448.00M | 496.00M | 595.00M | 287.64M | 358.94M | 325.27M |
| Other Expenses | 96.00M | 22.00M | -8.00M | 157.22M | 86.69M | 61.33M |
| Operating Expenses | 972.00M | 978.00M | 1.07B | 920.63M | 1.03B | 1.38B |
| Cost & Expenses | 6.26B | 6.85B | 6.65B | 6.48B | 7.37B | 8.03B |
| Interest Income | 149.00M | 51.00M | 5.70M | 3.10M | 11.38M | 10.28M |
| Interest Expense | 137.00M | 60.00M | 108.00M | 132.66M | 202.78M | 137.51M |
| Depreciation & Amortization | 1.45B | 1.62B | 1.62B | 2.52B | 2.68B | 2.95B |
| EBITDA | 2.64B | 3.27B | 1.56B | 1.31B | 1.76B | 503.15M |
| EBITDA Ratio | 35.66% | 35.84% | 23.55% | 21.04% | 20.36% | 18.89% |
| Operating Income | 1.13B | 1.17B | -68.00M | -1.50B | -1.49B | -2.52B |
| Operating Income Ratio | 15.27% | 14.39% | -1.03% | -30.97% | -25.72% | -40.72% |
| Total Other Income/Expenses | -45.00M | 365.00M | -116.00M | 291.00M | 477.67M | -86.29M |
| Income Before Tax | 1.08B | 1.53B | -176.00M | -1.36B | -1.15B | -2.61B |
| Income Before Tax Ratio | 14.66% | 18.89% | -2.67% | -28.10% | -19.73% | -42.12% |
| Income Tax Expense | 66.00M | 86.00M | 78.00M | -12.27M | 224.06M | 16.45M |
| Net Income | 1.02B | 1.45B | -254.00M | -1.35B | -1.37B | -2.70B |
| Net Income Ratio | 13.80% | 17.86% | -3.86% | -27.85% | -23.59% | -43.60% |
| EPS | 1.85 | 2.69 | -0.50 | -1.35 | -1.36 | -5.08 |
| EPS Diluted | 1.83 | 2.62 | -0.50 | -1.35 | -1.36 | -5.08 |
| Weighted Avg Shares Out | 552.00M | 539.00M | 505.76M | 1.00B | 1.01B | 531.85M |
| Weighted Avg Shares Out (Dil) | 556.00M | 552.00M | 505.76M | 1.00B | 1.01B | 531.85M |

5 microchip stocks set to skyrocket with billions in U.S. subsidies on the horizon

Infineon and GlobalFoundries Extend Long-Term Agreement with Focus on Automotive Microcontrollers

GlobalFoundries Announces Conference Call to Review Fourth Quarter and Full-Year 2023 Financial Results

GlobalFoundries Named to “America's Most Responsible Companies 2024” List

GlobalFoundries Names John Hollister as Chief Financial Officer

Weebit Nano receives wafers manufactured in GlobalFoundries' 22FDX® process

GlobalFoundries Announces New Multi-Million Dollar Student Loan Repayment Program to Strengthen Semiconductor Workforce

GlobalFoundries Posts Better-Than-Expected Earnings on Resilient Demand

GlobalFoundries rallies on 3Q earnings win, upbeat 4Q guidance

GLOBALFOUNDRIES Inc. (GFS) Q3 2023 Earnings Call Transcript
Source: https://incomestatements.info
Category: Stock Reports
