Complete financial analysis of Gem Diamonds Limited (GMDMF) income statement, including revenue, profit margins, EPS and key performance metrics. Get detailed insights into the financial performance of Gem Diamonds Limited, a leading company in the Other Precious Metals industry within the Basic Materials sector.
- Changchun Engley Automobile Industry Co.,Ltd. (601279.SS) Income Statement Analysis – Financial Results
- AB Volvo (publ) (VOLVF) Income Statement Analysis – Financial Results
- Akumin Inc. (AKU) Income Statement Analysis – Financial Results
- Aoyama Trading Co., Ltd. (8219.T) Income Statement Analysis – Financial Results
- aifinyo AG (EBE.DE) Income Statement Analysis – Financial Results
Gem Diamonds Limited (GMDMF)
About Gem Diamonds Limited
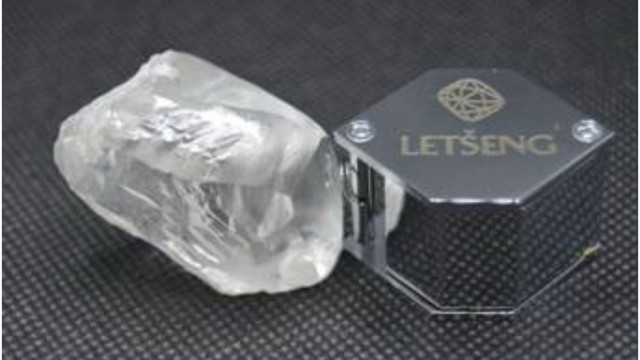
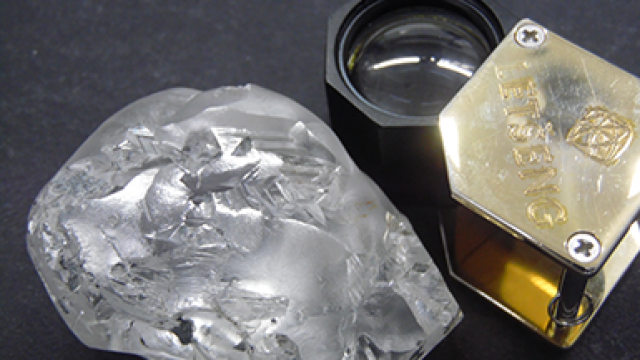
Gem Diamonds Limited operates diamond mines. The company's flagship project is the Letšeng mine located in the located in the Maluti Mountains of Lesotho. It is also involved in the production, manufacture, wholesale, retail, and marketing rough and polished diamonds. In addition, the company provides technical, financial, administrative, and management consulting services. It operates in Lesotho, Belgium, British Virgin Islands, Republic of South Africa, the United Kingdom, and Cyprus. The company was incorporated in 2005 and is headquartered in London, the United Kingdom.
| Metric | 2023 | 2022 | 2021 | 2020 | 2019 | 2018 | 2017 | 2016 | 2015 | 2014 | 2013 | 2012 | 2011 | 2010 | 2009 | 2008 | 2007 |
|---|---|---|---|---|---|---|---|---|---|---|---|---|---|---|---|---|---|
| Revenue | 140.29M | 188.94M | 201.86M | 189.65M | 182.05M | 267.29M | 214.30M | 189.82M | 249.48M | 270.89M | 212.83M | 202.12M | 395.57M | 266.38M | 243.34M | 296.88M | 152.71M |
| Cost of Revenue | 109.11M | 124.11M | 121.59M | 113.80M | 129.48M | 154.95M | 149.78M | 109.06M | 122.48M | 144.50M | 120.14M | 120.48M | 196.78M | 177.83M | 175.62M | 247.41M | 64.76M |
| Gross Profit | 31.18M | 64.82M | 80.27M | 75.85M | 52.57M | 112.34M | 64.51M | 80.75M | 126.99M | 126.40M | 92.69M | 81.64M | 198.79M | 88.54M | 67.72M | 49.47M | 87.95M |
| Gross Profit Ratio | 22.22% | 34.31% | 39.77% | 39.99% | 28.87% | 42.03% | 30.11% | 42.54% | 50.90% | 46.66% | 43.55% | 40.39% | 50.25% | 33.24% | 27.83% | 16.66% | 57.59% |
| Research & Development | 0.00 | 0.00 | 0.00 | 0.00 | 0.00 | 0.00 | 0.00 | 0.00 | 0.00 | 0.00 | 0.00 | 0.00 | 1.77M | 0.00 | 0.00 | 0.00 | 0.00 |
| General & Administrative | 0.00 | 9.00M | 8.89M | 7.99M | 9.42M | 10.32M | 9.50M | 11.23M | 11.94M | 12.63M | 14.12M | 0.00 | 0.00 | 0.00 | 0.00 | 0.00 | 813.00K |
| Selling & Marketing | 15.34M | 20.33M | 21.92M | 19.84M | 16.90M | 22.91M | 18.83M | 17.17M | 21.93M | 24.69M | 18.49M | 19.14M | 26.53M | 0.00 | 0.00 | 0.00 | 16.56M |
| SG&A | 15.34M | 20.33M | 21.92M | 19.84M | 16.90M | 22.91M | 18.83M | 17.17M | 21.93M | 24.69M | 18.49M | 19.14M | 26.53M | 0.00 | 0.00 | 0.00 | 17.37M |
| Other Expenses | 5.46M | 0.00 | 104.00K | 3.00K | 83.00K | -5.74M | 155.00K | -3.09M | -3.69M | 0.00 | 226.00K | 50.00K | 0.00 | 0.00 | 0.00 | 0.00 | 2.06M |
| Operating Expenses | 20.80M | 31.57M | 31.10M | 28.39M | 27.10M | 40.40M | 29.06M | 33.43M | 27.02M | 38.93M | 32.80M | 35.78M | 52.37M | 39.97M | 42.70M | 30.22M | 82.52M |
| Cost & Expenses | 129.91M | 155.68M | 152.68M | 142.19M | 156.58M | 195.35M | 178.84M | 142.50M | 149.51M | 183.42M | 152.93M | 156.26M | 249.15M | 217.81M | 218.32M | 277.63M | 147.28M |
| Interest Income | 617.00K | 303.00K | 197.00K | 358.00K | 668.00K | 2.03M | 630.00K | 1.23M | 1.10M | 2.58M | 992.00K | 2.51M | 3.76M | 4.03M | 2.70M | 3.84M | 23.36M |
| Interest Expense | 5.31M | 4.50M | 3.94M | 4.79M | 6.48M | 3.88M | 4.43M | 2.62M | 1.39M | 3.21M | 2.86M | 1.25M | 35.74K | 61.06K | 1.62M | 2.47M | 3.28M |
| Depreciation & Amortization | 46.51M | 45.14M | 55.86M | 56.90M | 61.43M | 74.26M | 81.60M | 46.25M | 57.59M | 64.47M | 52.51M | 95.64M | 69.99M | 57.60M | 58.13M | 72.91M | 20.57M |
| EBITDA | 57.51M | 79.63M | 100.75M | 95.54M | 92.14M | 153.08M | 111.20M | -68.77M | 167.53M | 163.07M | 114.39M | 131.64M | 223.67M | 109.58M | 99.00M | -292.22M | 92.83M |
| EBITDA Ratio | 40.99% | 42.49% | 52.88% | 52.44% | 48.32% | 57.27% | 51.89% | 51.06% | 67.15% | 59.29% | 53.67% | 73.16% | 57.07% | 41.14% | 40.62% | 25.33% | 46.97% |
| Operating Income | 10.38M | 34.52M | 50.41M | 42.66M | 29.86M | 74.84M | 34.11M | -123.90M | 108.44M | 92.71M | 60.66M | 33.43M | 153.60M | 52.27M | 39.48M | -367.53M | 49.39M |
| Operating Income Ratio | 7.40% | 18.27% | 24.97% | 22.50% | 16.40% | 28.00% | 15.92% | -65.27% | 43.47% | 34.22% | 28.50% | 16.54% | 38.83% | 19.62% | 16.22% | -123.80% | 32.34% |
| Total Other Income/Expenses | -4.70M | -4.09M | -3.96M | -4.41M | -5.81M | -7.38M | -3.80M | -209.00K | 120.00K | -2.24M | -1.64M | -8.80M | 2.14M | 2.21M | -224.75K | -359.46M | 19.06M |
| Income Before Tax | 5.68M | 30.43M | 46.67M | 38.25M | 24.05M | 72.99M | 30.31M | -124.11M | 108.56M | 92.93M | 59.02M | 34.75M | 155.73M | 54.48M | 39.25M | -367.60M | 68.44M |
| Income Before Tax Ratio | 4.05% | 16.11% | 23.12% | 20.17% | 13.21% | 27.31% | 14.14% | -65.38% | 43.51% | 34.31% | 27.73% | 17.19% | 39.37% | 20.45% | 16.13% | -123.82% | 44.82% |
| Income Tax Expense | 4.09M | 10.28M | 15.56M | 10.71M | 9.02M | 26.35M | 13.08M | 19.97M | 31.55M | 34.98M | 20.86M | 18.41M | 52.95M | 18.21M | 10.21M | 5.25M | 27.94M |
| Net Income | -2.13M | 10.18M | 14.77M | 13.64M | 2.62M | 26.02M | 5.48M | -158.81M | 52.03M | 33.22M | 21.17M | -117.86M | 67.67M | 20.19M | 15.53M | -552.82M | 23.23M |
| Net Income Ratio | -1.51% | 5.39% | 7.32% | 7.19% | 1.44% | 9.73% | 2.56% | -83.67% | 20.85% | 12.26% | 9.95% | -58.31% | 17.11% | 7.58% | 6.38% | -186.21% | 15.21% |
| EPS | -0.02 | 0.07 | 0.10 | 0.10 | 0.02 | 0.19 | 0.04 | -1.15 | 0.38 | 0.24 | 0.15 | -0.85 | 0.49 | 0.15 | 0.14 | -8.84 | 0.40 |
| EPS Diluted | -0.02 | 0.07 | 0.10 | 0.10 | 0.02 | 0.18 | 0.04 | -1.13 | 0.37 | 0.24 | 0.15 | -0.84 | 0.48 | 0.14 | 0.13 | -8.84 | 0.40 |
| Weighted Avg Shares Out | 139.53M | 139.80M | 140.29M | 139.27M | 138.96M | 138.73M | 138.48M | 138.27M | 138.23M | 138.20M | 138.19M | 138.18M | 138.17M | 138.15M | 114.91M | 62.56M | 57.40M |
| Weighted Avg Shares Out (Dil) | 139.53M | 141.66M | 142.09M | 141.61M | 141.60M | 142.00M | 141.34M | 140.00M | 139.70M | 139.17M | 138.88M | 139.53M | 140.32M | 138.15M | 120.97M | 62.56M | 58.22M |

Gem Diamonds shares up 8% after recovering 212-carat stone

Gem Diamonds loses more shine as rough prices slide

Gem Diamonds recovers 370 carat white diamond
Source: https://incomestatements.info
Category: Stock Reports
