See more : Health Catalyst, Inc. (HCAT) Income Statement Analysis – Financial Results
Complete financial analysis of Georgia Power Company 5% JR SUB NT 77 (GPJA) income statement, including revenue, profit margins, EPS and key performance metrics. Get detailed insights into the financial performance of Georgia Power Company 5% JR SUB NT 77, a leading company in the Regulated Electric industry within the Utilities sector.
- Tortoise Midstream Energy Fund, Inc. (NTG) Income Statement Analysis – Financial Results
- Artesian Resources Corporation (ARTNA) Income Statement Analysis – Financial Results
- Amarnath Securities Limited (AMARSEC.BO) Income Statement Analysis – Financial Results
- Being Holdings Co., Ltd. (9145.T) Income Statement Analysis – Financial Results
- Avalo Therapeutics, Inc. (AVTX) Income Statement Analysis – Financial Results
Georgia Power Company 5% JR SUB NT 77 (GPJA)
About Georgia Power Company 5% JR SUB NT 77
Georgia Power Co. engages in the generation, transmission, distribution, and purchase of electricity. It maintains a diverse generation mix that includes nuclear, coal and natural gas, and renewable such as solar, hydroelectric, and wind. The company was founded in 1883 and is headquartered in Atlanta, GA.
| Metric | 2023 | 2022 | 2021 | 2020 | 2019 | 2018 | 2017 | 2016 | 2015 | 2014 | 2013 | 2012 |
|---|---|---|---|---|---|---|---|---|---|---|---|---|
| Revenue | 10.12B | 29.28B | 9.26B | 8.31B | 8.41B | 8.42B | 8.31B | 8.38B | 8.33B | 8.99B | 8.27B | 8.00B |
| Cost of Revenue | 5.15B | 11.43B | 5.15B | 4.14B | 4.51B | 4.71B | 4.43B | 4.69B | 4.74B | 5.44B | 4.85B | 4.68B |
| Gross Profit | 4.97B | 17.85B | 4.11B | 4.17B | 3.90B | 3.71B | 3.88B | 3.69B | 3.59B | 3.55B | 3.43B | 3.32B |
| Gross Profit Ratio | 49.15% | 60.95% | 44.35% | 50.14% | 46.34% | 44.05% | 46.65% | 44.07% | 43.06% | 39.51% | 41.44% | 41.54% |
| Research & Development | 0.00 | 0.00 | 0.00 | 0.00 | 0.00 | 0.00 | 0.00 | 0.00 | 0.00 | 0.00 | 0.00 | 0.00 |
| General & Administrative | 0.00 | 0.00 | 0.00 | 0.00 | 0.00 | 0.00 | 0.00 | 0.00 | 0.00 | 0.00 | 0.00 | 0.00 |
| Selling & Marketing | 0.00 | 0.00 | 0.00 | 0.00 | 0.00 | 0.00 | 0.00 | 0.00 | 0.00 | 0.00 | 0.00 | 0.00 |
| SG&A | 183.00M | 211.00M | 182.00M | 131.00M | 89.00M | 73.00M | 72.00M | 0.00 | 0.00 | 0.00 | 0.00 | 0.00 |
| Other Expenses | 1.97B | 23.91B | 0.00 | 0.00 | 0.00 | 0.00 | 0.00 | 0.00 | 0.00 | 0.00 | 0.00 | 0.00 |
| Operating Expenses | 1.82B | 23.91B | 3.27B | 2.01B | 1.30B | 2.31B | 1.20B | 1.18B | 1.18B | 1.23B | 1.15B | 1.08B |
| Cost & Expenses | 6.96B | 35.34B | 8.42B | 6.16B | 5.81B | 7.02B | 5.63B | 5.87B | 5.92B | 6.67B | 6.00B | 5.76B |
| Interest Income | 626.00M | 485.00M | 421.00M | 425.00M | 409.00M | 397.00M | 419.00M | 388.00M | 363.00M | 348.00M | 361.00M | 366.00M |
| Interest Expense | 0.00 | 2.02B | 0.00 | 0.00 | 0.00 | 0.00 | 0.00 | 0.00 | 0.00 | 0.00 | 0.00 | 0.00 |
| Depreciation & Amortization | 1.91B | 1.62B | 1.56B | 1.61B | 1.19B | 1.14B | 1.10B | 1.06B | 1.03B | 1.02B | 979.00M | 912.00M |
| EBITDA | 4.85B | 4.37B | 4.00B | 4.04B | 3.74B | 3.56B | 3.75B | 3.50B | 3.38B | 3.32B | 3.22B | 3.12B |
| EBITDA Ratio | 47.91% | 35.54% | 43.19% | 48.56% | 44.52% | 42.33% | 45.07% | 41.72% | 40.56% | 36.88% | 38.91% | 38.95% |
| Operating Income | 2.93B | 6.34B | 2.44B | 2.43B | 2.55B | 2.42B | 2.65B | 2.43B | 2.35B | 2.30B | 2.24B | 2.20B |
| Operating Income Ratio | 29.00% | 21.66% | 26.37% | 29.22% | 30.33% | 28.76% | 31.83% | 29.03% | 28.20% | 25.55% | 27.07% | 27.54% |
| Total Other Income/Expenses | -406.00M | -4.16B | -152.00M | -245.00M | -269.00M | -282.00M | -315.00M | -307.00M | -302.00M | -325.00M | -326.00M | -330.00M |
| Income Before Tax | 2.53B | 4.22B | 416.00M | 1.73B | 2.19B | 1.01B | 2.26B | 2.13B | 2.05B | 1.97B | 1.91B | 1.87B |
| Income Before Tax Ratio | 24.99% | 14.42% | 4.49% | 20.78% | 26.07% | 11.96% | 27.17% | 25.37% | 24.57% | 21.93% | 23.13% | 23.42% |
| Income Tax Expense | 448.00M | 795.00M | 168.00M | 152.00M | 472.00M | 214.00M | 830.00M | 780.00M | 769.00M | 729.00M | 723.00M | 688.00M |
| Net Income | 2.08B | 3.43B | 584.00M | 1.58B | 1.72B | 793.00M | 1.41B | 1.33B | 1.26B | 1.23B | 1.17B | 1.17B |
| Net Income Ratio | 20.56% | 11.71% | 6.31% | 18.96% | 20.46% | 9.42% | 17.02% | 15.87% | 15.13% | 13.63% | 14.19% | 14.60% |
| EPS | 224.59 | 370.13 | 63.06 | 170.06 | 185.72 | 85.62 | 152.68 | 143.61 | 136.05 | 136.11 | 130.44 | 129.78 |
| EPS Diluted | 224.59 | 370.13 | 63.06 | 170.06 | 185.72 | 85.62 | 152.68 | 143.61 | 136.05 | 136.11 | 130.44 | 129.78 |
| Weighted Avg Shares Out | 9.26M | 9.26M | 9.26M | 9.26M | 9.26M | 9.26M | 9.26M | 9.26M | 9.26M | 9.00M | 9.00M | 9.00M |
| Weighted Avg Shares Out (Dil) | 9.26M | 9.26M | 9.26M | 9.26M | 9.26M | 9.26M | 9.26M | 9.26M | 9.26M | 9.00M | 9.00M | 9.00M |

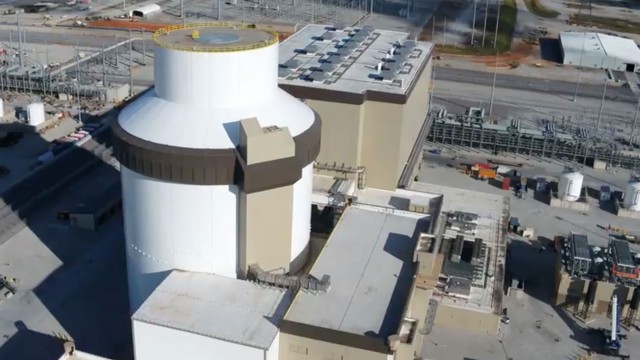
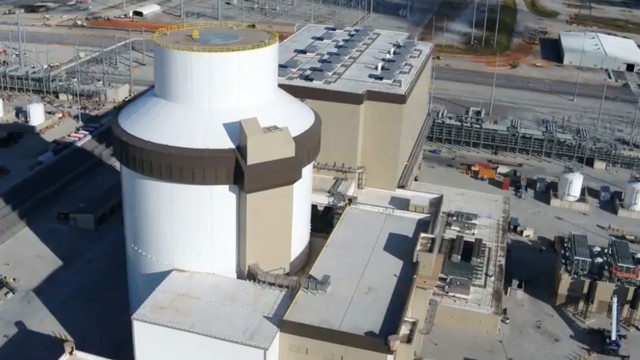
America's first new nuclear reactor in nearly seven years starts operations

A new nuclear reactor in the U.S. starts up. It's the first in nearly seven years
Source: https://incomestatements.info
Category: Stock Reports
