See more : Asian Hotels (East) Limited (AHLEAST.NS) Income Statement Analysis – Financial Results
Complete financial analysis of Great Panther Mining Limited (GPL) income statement, including revenue, profit margins, EPS and key performance metrics. Get detailed insights into the financial performance of Great Panther Mining Limited, a leading company in the Gold industry within the Basic Materials sector.
- Joinsoon Electronics Manufacturing CO., LTD. (3322.TWO) Income Statement Analysis – Financial Results
- Patidar Buildcon Limited (PATIDAR.BO) Income Statement Analysis – Financial Results
- Magnum Opus Acquisition Limited (OPA-WT) Income Statement Analysis – Financial Results
- Global Capital Partners Inc. (GCPL) Income Statement Analysis – Financial Results
- American Virtual Cloud Technologies Inc (AVCTW) Income Statement Analysis – Financial Results
Great Panther Mining Limited (GPL)
About Great Panther Mining Limited
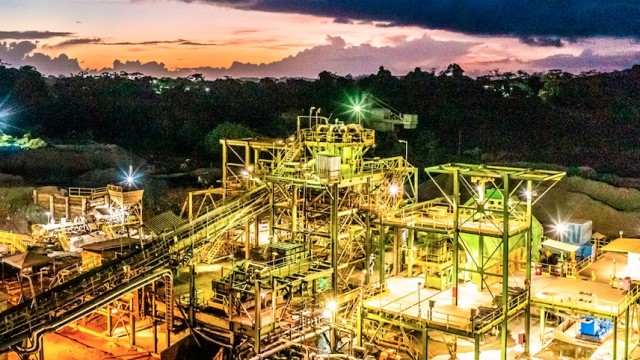
Great Panther Mining Limited operates as a precious metals mining and exploration company. It explores for gold, silver, copper, lead, and zinc ores. The company operates three mines, including the Tucano gold mine in Amapá State, Brazil; and the Guanajuato mine complex and the Topia mine in Mexico, as well as Coricancha mine complex in the central Andes, Peru. Its exploration properties also include the El Horcón, Santa Rosa, and Plomo projects in Mexico. The company was formerly known as Great Panther Silver Limited and changed its name to Great Panther Mining Limited in March 2019. Great Panther Mining Limited was incorporated in 1965 and is headquartered in Vancouver, Canada.
| Metric | 2021 | 2020 | 2019 | 2018 | 2017 | 2016 | 2015 | 2014 | 2013 | 2012 | 2011 | 2010 | 2009 | 2008 | 2007 | 2006 | 2005 | 2004 | 2003 | 2002 | 2001 | 2000 |
|---|---|---|---|---|---|---|---|---|---|---|---|---|---|---|---|---|---|---|---|---|---|---|
| Revenue | 185.68M | 260.81M | 198.65M | 59.43M | 63.75M | 61.88M | 52.87M | 46.85M | 50.67M | 61.46M | 56.63M | 42.20M | 30.30M | 18.44M | 17.66M | 6.07M | 0.00 | 21.65K | 295.35 | 56.53 | 1.92K | 29.70K |
| Cost of Revenue | 186.56M | 176.94M | 191.81M | 51.25M | 46.06M | 39.86M | 48.77M | 52.16M | 50.07M | 42.15M | 30.27M | 23.52M | 16.01M | 20.11M | 16.27M | 7.32M | 2.02M | 0.00 | 0.00 | 0.00 | 0.00 | 0.00 |
| Gross Profit | -882.00K | 83.87M | 6.85M | 8.19M | 17.69M | 22.02M | 4.11M | -5.31M | 601.07K | 19.31M | 26.36M | 18.68M | 14.29M | -1.67M | 1.38M | -1.26M | -2.02M | 21.65K | 295.35 | 56.53 | 1.92K | 29.70K |
| Gross Profit Ratio | -0.48% | 32.16% | 3.45% | 13.77% | 27.75% | 35.59% | 7.77% | -11.33% | 1.19% | 31.41% | 46.55% | 44.27% | 47.16% | -9.03% | 7.84% | -20.72% | 0.00% | 100.00% | 100.00% | 100.00% | 100.00% | 100.00% |
| Research & Development | 0.00 | 0.00 | 0.00 | 0.00 | 0.00 | 0.00 | 0.00 | 0.00 | 0.00 | 0.00 | 0.00 | 0.00 | 0.00 | 0.00 | 0.00 | 0.00 | 0.00 | 0.00 | 0.00 | 0.00 | 0.00 | 0.00 |
| General & Administrative | 14.21M | 12.48M | 17.09M | 6.29M | 7.80M | 5.72M | 5.73M | 5.53M | 6.79M | 10.00M | 8.82M | 6.73M | 7.81M | 0.00 | 5.88M | 7.78M | 0.00 | 0.00 | 0.00 | 0.00 | 0.00 | 0.00 |
| Selling & Marketing | 0.00 | 0.00 | 0.00 | 0.00 | 0.00 | 0.00 | 0.00 | 0.00 | 0.00 | 0.00 | 0.00 | 0.00 | 0.00 | 0.00 | 0.00 | 0.00 | 0.00 | 0.00 | 0.00 | 0.00 | 0.00 | 0.00 |
| SG&A | 14.21M | 12.48M | 17.09M | 6.29M | 7.80M | 5.72M | 5.73M | 5.53M | 6.79M | 10.00M | 8.82M | 6.73M | 7.81M | 6.22M | 5.88M | 7.78M | 2.17M | 1.02M | 215.06K | 432.27K | 168.52K | 136.07K |
| Other Expenses | 18.21M | 14.43M | 28.69M | 14.05M | 10.33M | 6.23M | 5.99M | 4.08M | 2.50M | 2.56M | 95.00K | 7.16M | 4.93M | 8.72M | 10.51M | 3.41M | 10.83K | 2.26K | 1.52K | 1.32K | 1.66K | 4.42K |
| Operating Expenses | 32.42M | 26.91M | 45.78M | 20.34M | 18.14M | 11.94M | 11.72M | 9.61M | 9.29M | 12.56M | 8.92M | 13.89M | 12.74M | 14.94M | 16.39M | 11.19M | 2.18M | 1.02M | 216.58K | 433.59K | 170.18K | 140.49K |
| Cost & Expenses | 218.98M | 203.85M | 237.59M | 71.59M | 64.19M | 51.80M | 60.49M | 61.77M | 59.36M | 54.71M | 39.19M | 37.41M | 28.75M | 35.05M | 32.66M | 18.51M | 4.19M | 1.02M | 216.58K | 433.59K | 170.18K | 140.49K |
| Interest Income | 248.00K | 347.00K | 726.00K | 1.52M | 808.00K | 225.00K | 209.70K | 194.68K | 314.62K | 444.30K | 426.05K | 115.98K | 56.30K | 197.97K | 209.93K | 314.28K | 23.46K | 21.65K | 295.35 | 56.53 | 1.92K | 2.28K |
| Interest Expense | 2.60M | 3.98M | 5.75M | 20.00K | 171.00K | 99.00K | 123.23K | 49.96K | 49.78K | 6.03K | 271.30K | 933.85K | 1.12M | 949.22K | 1.05M | 712.28K | 307.40K | 0.00 | 4.19K | 0.00 | 0.00 | 0.00 |
| Depreciation & Amortization | 31.00M | 40.75M | 35.19M | 3.57M | 3.95M | 5.58M | 13.13M | 14.54M | 12.54M | 8.94M | 4.47M | 2.41M | 3.42M | 3.52M | 3.64M | 1.22M | 10.83K | 2.26K | 1.52K | 1.32K | 1.66K | 4.42K |
| EBITDA | -8.60M | 48.86M | -49.34M | -5.82M | 6.88M | 3.07M | 6.52M | -12.06M | -2.64M | 18.70M | 12.40M | 6.58M | 4.34M | -7.80M | -12.61M | -10.91M | -4.51M | -982.16K | -205.39K | -431.19K | -190.14K | -166.71K |
| EBITDA Ratio | -4.63% | 18.73% | -24.84% | -9.79% | 10.79% | 4.95% | 12.33% | -25.74% | -5.20% | 30.43% | 31.70% | 15.59% | 14.33% | -42.31% | -71.43% | -179.96% | 0.00% | -4,536.77% | -69,540.21% | -762,730.34% | -9,904.91% | -561.26% |
| Operating Income | -39.60M | 56.95M | -38.94M | -12.15M | 343.00K | 10.08M | 7.61M | 25.48M | 9.00M | 6.77M | 17.44M | 4.59M | 1.29M | 11.64M | 15.01M | 12.45M | 4.54M | 996.79K | 216.28K | 433.53K | 191.80K | 171.13K |
| Operating Income Ratio | -21.33% | 21.84% | -19.60% | -20.45% | 0.54% | 16.29% | 14.40% | 54.39% | 17.77% | 11.02% | 30.80% | 10.87% | 4.25% | 63.12% | 84.98% | 205.26% | 0.00% | 4,604.36% | 73,229.76% | 766,868.54% | 9,991.46% | 576.13% |
| Total Other Income/Expenses | -2.60M | -52.83M | -51.34M | 2.74M | 2.41M | -12.69M | -14.35M | -52.14M | -24.23M | 2.99M | 869.52K | -1.35M | -1.48M | -23.92M | -32.30M | -25.30M | -9.36M | 12.37K | 9.38K | 1.02K | -47.07K | -93.26K |
| Income Before Tax | -42.20M | 4.13M | -90.28M | -9.41M | 2.76M | -2.61M | -6.73M | -26.65M | -15.22M | 9.76M | 13.21M | 3.23M | -189.85K | -12.27M | -17.30M | -12.85M | -4.82M | 1.01M | 225.66K | 434.55K | 144.73K | 77.87K |
| Income Before Tax Ratio | -22.73% | 1.58% | -45.45% | -15.83% | 4.32% | -4.22% | -12.74% | -56.88% | -30.04% | 15.88% | 23.33% | 7.66% | -0.63% | -66.55% | -97.95% | -211.82% | 0.00% | 4,661.49% | 76,404.96% | 768,674.16% | 7,539.56% | 262.15% |
| Income Tax Expense | 39.00K | 3.79M | 744.00K | 652.00K | 1.47M | 1.51M | -3.60K | 1.79M | -3.27M | 4.22M | 1.94M | -1.74M | 638.01K | -535.32K | 2.60M | 94.39K | -319.02K | 12.37K | 13.56K | 1.02K | -47.07K | -93.26K |
| Net Income | -42.24M | 334.00K | -91.02M | -10.06M | 1.29M | -4.12M | -6.73M | -28.44M | -11.95M | 5.54M | 11.27M | 4.97M | -827.86K | -11.74M | -19.89M | -12.94M | -4.50M | -984.42K | -211.09K | -432.51K | -191.80K | -171.13K |
| Net Income Ratio | -22.75% | 0.13% | -45.82% | -16.93% | 2.02% | -6.65% | -12.73% | -60.70% | -23.59% | 9.01% | 19.90% | 11.78% | -2.73% | -63.65% | -112.66% | -213.38% | 0.00% | -4,547.22% | -71,472.06% | -765,062.92% | -9,991.46% | -576.13% |
| EPS | -1.19 | 0.01 | -3.33 | -0.60 | 0.08 | -0.27 | -0.48 | -2.04 | -0.87 | 0.40 | 0.86 | 0.43 | -0.09 | -1.44 | -2.75 | -2.17 | -1.88 | -0.73 | -1.21 | -3.13 | -1.74 | -2.18 |
| EPS Diluted | -1.19 | 0.01 | -3.33 | -0.60 | 0.08 | -0.27 | -0.48 | -2.04 | -0.87 | 0.40 | 0.83 | 0.42 | -0.09 | -1.44 | -2.75 | -2.17 | -1.88 | -0.63 | -1.21 | -3.00 | -1.74 | -2.18 |
| Weighted Avg Shares Out | 35.58M | 34.42M | 27.34M | 16.89M | 16.80M | 15.42M | 14.09M | 13.91M | 13.82M | 13.77M | 13.11M | 11.44M | 9.02M | 8.13M | 7.22M | 5.97M | 2.40M | 1.34M | 174.82K | 138.02K | 110.47K | 78.47K |
| Weighted Avg Shares Out (Dil) | 35.58M | 34.42M | 27.34M | 16.89M | 17.13M | 15.42M | 14.09M | 13.91M | 13.82M | 13.87M | 13.54M | 11.89M | 9.02M | 8.13M | 7.22M | 5.97M | 2.40M | 1.56M | 174.82K | 144.27K | 110.47K | 78.47K |

Graft Polymer CEO thrilled Awakn Life Sciences partnership progress

Newrange Gold acquires Coricancha mine in Peru from Great Panther Mining

Great Panther Mining inks deal to sell Coricancha mine in Peru to Newrange Gold Corp

Great Panther (GPL) Q2 Earnings & Revenues Miss Estimates

Great Panther Mining closes sale of Mexican subsidiary

Great Panther Mining Limited (GPL) CEO Alan Hair on Q2 2022 Results - Earnings Call Transcript

Great Panther Mining continues to focus on operational efficiencies at its Brazil gold mine as it posts Q2 results

Are Penny Stocks Worth It In 2022? What To Know Now

Great Panther produces 20,187 gold equivalent ounces in Q2 2022, down 27% y-o-y

Great Panther Mining (GPL) to Divest Silver Mines in Mexico
Source: https://incomestatements.info
Category: Stock Reports
