See more : Hubei Guochuang Hi-tech Material Co.,Ltd (002377.SZ) Income Statement Analysis – Financial Results
Complete financial analysis of Cerro de Pasco Resources Inc. (GPPRF) income statement, including revenue, profit margins, EPS and key performance metrics. Get detailed insights into the financial performance of Cerro de Pasco Resources Inc., a leading company in the Industrial Materials industry within the Basic Materials sector.
- PT Global Sukses Solusi Tbk (RUNS.JK) Income Statement Analysis – Financial Results
- Archies Limited (ARCHIES.NS) Income Statement Analysis – Financial Results
- FRONTIER CAPITAL LIMITED (FRONTCAP.BO) Income Statement Analysis – Financial Results
- Aris Water Solutions, Inc. (ARIS) Income Statement Analysis – Financial Results
- PT Trisula International Tbk (TRIS.JK) Income Statement Analysis – Financial Results
Cerro de Pasco Resources Inc. (GPPRF)
About Cerro de Pasco Resources Inc.
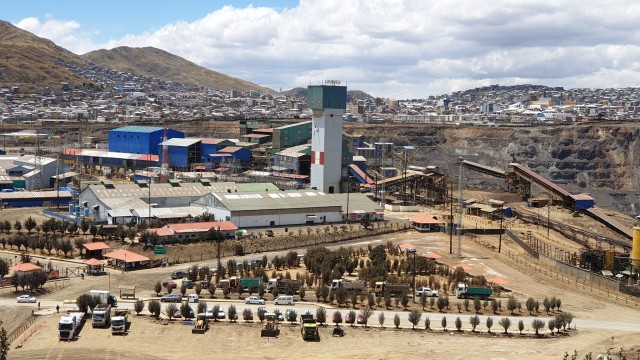
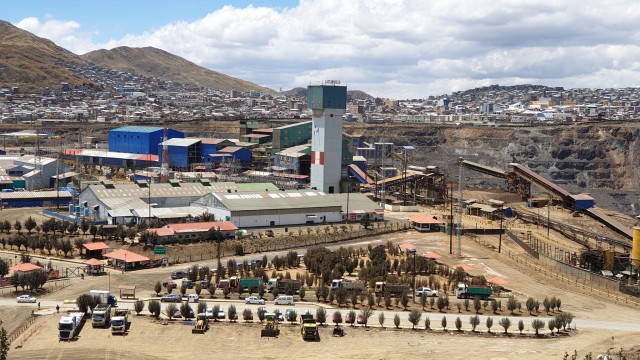
Cerro de Pasco Resources Inc., a natural resource company, engages in the acquisition, exploration, and development of mineral properties. The company primarily explores for zinc, lead, and silver deposits. It holds 100% interests in the El Metalurgista mining concession covering an area of approximately 95.74 hectares located in Lima, Peru. The company was founded in 2012 and is headquartered in Saint-Sauveur, Canada.
| Metric | 2023 | 2022 | 2021 | 2020 | 2019 | 2018 | 2017 | 2016 | 2015 | 2014 | 2013 | 2012 | 2011 | 2010 | 2009 | 2008 | 2006 | 2005 | 2004 |
|---|---|---|---|---|---|---|---|---|---|---|---|---|---|---|---|---|---|---|---|
| Revenue | 20.29M | 40.59M | 9.11M | 0.00 | 0.00 | 0.00 | 0.00 | 0.00 | 0.00 | 0.00 | 0.00 | 0.00 | 0.00 | 0.00 | 0.00 | 0.00 | 0.00 | 0.00 | 0.00 |
| Cost of Revenue | 32.30M | 41.83M | 5.79M | 122.40K | 81.93K | 1.92K | 0.00 | 11.40K | 13.82K | 0.00 | 0.00 | 0.00 | 0.00 | 0.00 | 0.00 | 0.00 | 0.00 | 0.00 | 0.00 |
| Gross Profit | -12.01M | -1.24M | 3.32M | -122.40K | -81.93K | -1.92K | 0.00 | -11.40K | -13.82K | 0.00 | 0.00 | 0.00 | 0.00 | 0.00 | 0.00 | 0.00 | 0.00 | 0.00 | 0.00 |
| Gross Profit Ratio | -59.18% | -3.04% | 36.48% | 0.00% | 0.00% | 0.00% | 0.00% | 0.00% | 0.00% | 0.00% | 0.00% | 0.00% | 0.00% | 0.00% | 0.00% | 0.00% | 0.00% | 0.00% | 0.00% |
| Research & Development | 0.00 | 247.45K | 683.14K | 1.00M | 599.83K | 251.13K | 0.00 | 29.60K | 54.21K | 440.55K | 6.67K | 0.00 | 0.00 | 0.00 | 0.00 | 0.00 | 0.00 | 0.00 | 0.00 |
| General & Administrative | 14.21M | 7.04M | 4.52M | 6.78M | 4.68M | 1.70M | 777.07K | 506.15K | 1.06M | 900.02K | 213.35K | 37.66K | 0.00 | 0.00 | 0.00 | 86.86K | 0.00 | 0.00 | 0.00 |
| Selling & Marketing | 1.50M | 1.01M | 177.99K | 1.00M | 599.83K | 0.00 | 0.00 | 0.00 | 0.00 | 0.00 | 0.00 | 0.00 | 0.00 | 0.00 | 0.00 | 0.00 | 0.00 | 0.00 | 0.00 |
| SG&A | 15.71M | 8.05M | 4.70M | 6.78M | 4.68M | 1.70M | 777.07K | 506.15K | 1.06M | 900.02K | 213.35K | 37.66K | 45.94K | 39.93K | 24.98K | 86.86K | 2.49M | 1.49M | 148.70K |
| Other Expenses | -1.00 | 4.35M | 972.04K | -597.07K | -355.03K | -13.68M | 3.04M | 902.85K | 296.52K | 188.65K | 0.00 | 0.00 | 0.00 | 0.00 | -26.50K | 174.92K | 37.57K | 6.67K | 0.00 |
| Operating Expenses | 15.71M | 12.65M | 5.67M | 7.18M | 4.92M | 1.82M | 3.81M | 1.44M | 1.42M | 1.53M | 220.02K | 37.66K | 45.94K | 39.93K | -1.52K | 261.78K | 2.52M | 1.49M | 148.70K |
| Cost & Expenses | 48.01M | 54.47M | 11.46M | 7.18M | 4.92M | 1.82M | 3.81M | 1.44M | 1.42M | 1.53M | 220.02K | 37.66K | 45.94K | 39.93K | -1.52K | 261.78K | 2.52M | 1.49M | 148.70K |
| Interest Income | -571.97K | 73.67K | 66.48K | 0.00 | 0.00 | 0.00 | 0.00 | 0.00 | 0.00 | 0.00 | 0.00 | 0.00 | 0.00 | 0.00 | 0.00 | 0.00 | 0.00 | 0.00 | 0.00 |
| Interest Expense | 2.06M | 1.01M | 510.09K | 109.35K | 13.65K | 0.00 | 3.34K | 11.96K | 17.31K | 0.00 | 0.00 | 0.00 | 0.00 | 0.00 | 0.00 | 0.00 | 0.00 | 0.00 | 0.00 |
| Depreciation & Amortization | 2.47M | 2.48M | 483.53K | 122.40K | 81.93K | 1.92K | 504.00 | 11.40K | 13.82K | 1.32K | 119.20K | 0.00 | 0.00 | 0.00 | 0.00 | 0.00 | 37.57K | 6.67K | 0.00 |
| EBITDA | -25.53M | -13.23M | -797.29K | -7.17M | -4.86M | -15.38M | -639.01K | -1.19M | -3.74M | -1.70M | -100.82K | -37.66K | -45.94K | -39.93K | 1.52K | -261.78K | -2.49M | -1.49M | -148.70K |
| EBITDA Ratio | -125.81% | -29.12% | -19.31% | 0.00% | 0.00% | 0.00% | 0.00% | 0.00% | 0.00% | 0.00% | 0.00% | 0.00% | 0.00% | 0.00% | 0.00% | 0.00% | 0.00% | 0.00% | 0.00% |
| Operating Income | -27.72M | -13.47M | -2.35M | -7.13M | -4.79M | -1.77M | -3.80M | -1.44M | -1.42M | -1.31M | -220.02K | -37.66K | -45.94K | -39.93K | 1.52K | -261.78K | -2.52M | -1.49M | -148.70K |
| Operating Income Ratio | -136.63% | -33.18% | -25.77% | 0.00% | 0.00% | 0.00% | 0.00% | 0.00% | 0.00% | 0.00% | 0.00% | 0.00% | 0.00% | 0.00% | 0.00% | 0.00% | 0.00% | 0.00% | 0.00% |
| Total Other Income/Expenses | -3.82M | -2.92M | 551.79K | -284.03K | -111.48K | -13.62M | -105.04K | 227.62K | -2.35M | -438.54K | -119.20K | 0.00 | 0.00 | 0.00 | 0.00 | 0.00 | 0.00 | 0.00 | 0.00 |
| Income Before Tax | -31.54M | -16.39M | -1.80M | -7.41M | -5.04M | -15.38M | -3.82M | -1.21M | -3.77M | -1.75M | -339.22K | -37.66K | -45.94K | -39.93K | 0.00 | 0.00 | 0.00 | 0.00 | 0.00 |
| Income Before Tax Ratio | -155.45% | -40.39% | -19.71% | 0.00% | 0.00% | 0.00% | 0.00% | 0.00% | 0.00% | 0.00% | 0.00% | 0.00% | 0.00% | 0.00% | 0.00% | 0.00% | 0.00% | 0.00% | 0.00% |
| Income Tax Expense | 206.46K | 2.22M | 817.20K | 33.26K | 62.80K | -110.47K | -95.37K | -53.82K | -122.96K | 340.73K | 119.20K | 0.00 | 0.00 | 0.00 | -1.52K | -2.52M | 0.00 | 1.76K | -5.93K |
| Net Income | -31.76M | -18.61M | -2.61M | -7.45M | -5.10M | -15.38M | -3.72M | -1.08M | -4.65M | -1.65M | -339.22K | -37.66K | -45.94K | -39.93K | 1.52K | 2.26M | -2.52M | -1.50M | -142.78K |
| Net Income Ratio | -156.52% | -45.85% | -28.68% | 0.00% | 0.00% | 0.00% | 0.00% | 0.00% | 0.00% | 0.00% | 0.00% | 0.00% | 0.00% | 0.00% | 0.00% | 0.00% | 0.00% | 0.00% | 0.00% |
| EPS | -0.10 | -0.06 | -0.01 | -0.03 | -0.02 | -0.10 | -0.04 | -0.07 | -0.45 | -0.33 | -0.27 | -0.06 | -0.09 | -0.04 | 0.00 | 2.02 | -2.49 | -2.24 | -1.68 |
| EPS Diluted | -0.10 | -0.06 | -0.01 | -0.03 | -0.02 | -0.10 | -0.04 | -0.07 | -0.45 | -0.33 | -0.27 | -0.06 | -0.09 | -0.04 | 0.00 | 2.02 | -2.49 | -2.24 | -1.68 |
| Weighted Avg Shares Out | 317.70M | 287.65M | 270.86M | 260.21M | 249.84M | 160.49M | 95.18M | 14.56M | 10.22M | 5.07M | 1.27M | 624.04K | 518.03K | 1.07M | 1.12M | 1.12M | 1.01M | 666.67K | 85.00K |
| Weighted Avg Shares Out (Dil) | 317.57M | 287.65M | 270.86M | 260.21M | 249.84M | 160.49M | 95.18M | 14.56M | 10.22M | 5.07M | 1.27M | 624.04K | 518.03K | 1.07M | 1.12M | 1.12M | 1.01M | 666.67K | 85.00K |

Cerro de Pasco Resources Closes a Subscription Receipt and Private Placement for a total of $2,845,000

Cerro de Pasco Resources to kick off drill campaign in Peru after securing funds for easement

Cerro de Pasco Resources Secures Funds for Easement to Start Drilling Program on its “El Metalurgista” Mining Concession in Peru

Cerro de Pasco Resources Announces Change of Financial Year-End and Appointment of New Auditors

Cerro de Pasco Resources eyes operations restart at Santander project as it restructures liabilities

Cerro de Pasco Resources Restructures Santander Liabilities

Cerro de Pasco Resources Closes Second Tranche of Private Placement for Total Current Financing of $2.0 Million

Cerro de Pasco Resources sets the stage for a productive year in Peru

Cerro de Pasco Resources gets go-ahead for land easement application process for Quiulacocha tailings

Cerro de Pasco Resources receives Green Light on Land Easement Application Process for Quiulacocha Tailings
Source: https://incomestatements.info
Category: Stock Reports
