See more : EPI (Holdings) Limited (0689.HK) Income Statement Analysis – Financial Results
Complete financial analysis of Harbour Energy plc (HBRIY) income statement, including revenue, profit margins, EPS and key performance metrics. Get detailed insights into the financial performance of Harbour Energy plc, a leading company in the Oil & Gas Exploration & Production industry within the Energy sector.
- Paladin Limited (0495.HK) Income Statement Analysis – Financial Results
- Anand Rayons Limited (ARL.BO) Income Statement Analysis – Financial Results
- Tuscan Holdings Corp. (THCBW) Income Statement Analysis – Financial Results
- Brilliance China Automotive Holdings Limited (BCAUF) Income Statement Analysis – Financial Results
- Star Paper Mills Limited (STARPAPER.BO) Income Statement Analysis – Financial Results
Harbour Energy plc (HBRIY)
About Harbour Energy plc
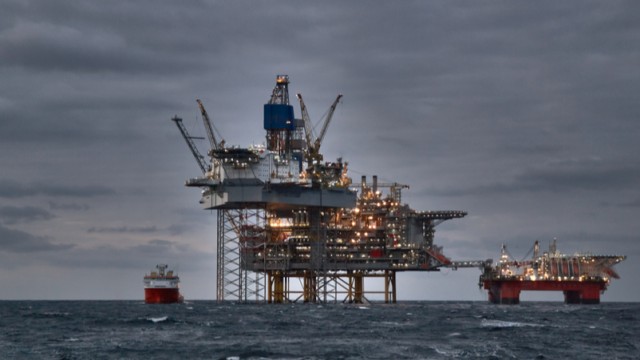
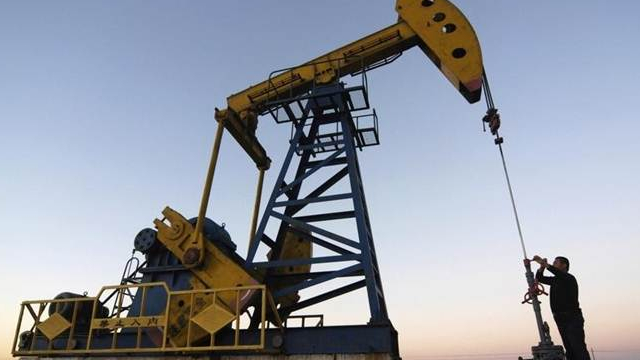
Harbour Energy plc, an independent oil and gas company, engages in the acquisition, exploration, development, and production of oil and gas reserves. It holds 124 license interests and 48 producing fields in various properties located in the United Kingdom, Norwegian Continental Shelves, Indonesia, Vietnam, and Mexico. The company is based in Edinburgh, the United Kingdom.
| Metric | 2023 | 2022 | 2021 | 2020 | 2019 | 2018 | 2017 | 2016 | 2015 | 2014 | 2013 |
|---|---|---|---|---|---|---|---|---|---|---|---|
| Revenue | 3.75B | 5.39B | 3.48B | 2.41B | 1.58B | 1.40B | 1.04B | 937.00M | 1.07B | 0.00 | 0.00 |
| Cost of Revenue | 2.58B | 2.84B | 2.45B | 1.85B | 1.12B | 986.50M | 950.60M | 829.00M | 816.10M | 0.00 | 0.00 |
| Gross Profit | 1.17B | 2.55B | 1.03B | 566.40M | 460.20M | 411.00M | 92.50M | 108.00M | 251.10M | 0.00 | 0.00 |
| Gross Profit Ratio | 31.11% | 47.22% | 29.48% | 23.47% | 29.04% | 29.41% | 8.87% | 11.53% | 23.53% | 0.00% | 0.00% |
| Research & Development | 0.00 | 0.00 | 0.00 | 0.00 | 0.00 | 0.00 | 0.00 | 0.00 | 0.00 | 0.00 | 0.00 |
| General & Administrative | 114.00M | 83.60M | 102.50M | 48.60M | 37.29M | 24.69M | 29.45M | 2.60M | 2.23M | 6.02M | 2.71M |
| Selling & Marketing | 0.00 | 0.00 | 0.00 | 0.00 | -28.29M | -10.69M | -12.65M | 21.50M | 12.17M | 0.00 | 0.00 |
| SG&A | 114.00M | 83.60M | 102.50M | 48.60M | 9.00M | 14.00M | 16.80M | 24.10M | 14.40M | 6.02M | 2.71M |
| Other Expenses | 0.00 | 41.20M | 139.20M | 24.20M | 0.00 | 0.00 | 0.00 | 0.00 | 0.00 | 0.00 | 0.00 |
| Operating Expenses | 114.00M | 162.80M | 152.30M | 61.80M | 9.00M | 14.00M | 16.80M | 24.10M | 14.40M | 179.04M | 1.15M |
| Cost & Expenses | 2.70B | 3.01B | 2.61B | 1.91B | 1.13B | 1.00B | 967.40M | 853.10M | 830.50M | 179.04M | 1.15M |
| Interest Income | 27.00M | 31.90M | 7.30M | 11.40M | 7.70M | 179.13M | 30.85M | 19.00K | 36.87K | 40.52K | 79.52K |
| Interest Expense | 259.00M | 199.30M | 229.00M | 301.70M | 283.60M | 0.00 | 0.00 | 0.00 | 0.00 | 0.00 | 0.00 |
| Depreciation & Amortization | 1.43B | 1.64B | 1.40B | 1.25B | 760.40M | 451.30M | 478.10M | 357.80M | 372.80M | 125.03M | 21.54K |
| EBITDA | 2.29B | 4.33B | 1.93B | 1.35B | 1.14B | 868.10M | 317.40M | 70.90M | -402.70M | -10.16M | 1.17M |
| EBITDA Ratio | 60.94% | 75.94% | 65.40% | 55.97% | 76.46% | 60.70% | 53.09% | 47.14% | 57.11% | 0.00% | 0.00% |
| Operating Income | 782.00M | 2.54B | 640.30M | -687.40M | 451.20M | 397.00M | 75.70M | 83.90M | 236.70M | -135.20M | 1.15M |
| Operating Income Ratio | 20.85% | 47.14% | 18.41% | -28.48% | 28.47% | 28.41% | 7.26% | 8.95% | 22.18% | 0.00% | 0.00% |
| Total Other Income/Expenses | -185.00M | -79.00M | -238.90M | -627.40M | -348.70M | -238.80M | -442.00M | -497.80M | -1.06B | -43.80M | 284.25M |
| Income Before Tax | 597.00M | 2.46B | 314.50M | -977.70M | 102.50M | 158.20M | -366.30M | -413.90M | -827.70M | -178.99M | 1.23M |
| Income Before Tax Ratio | 15.92% | 45.67% | 9.04% | -40.51% | 6.47% | 11.32% | -35.12% | -44.17% | -77.56% | 0.00% | 0.00% |
| Income Tax Expense | 565.00M | 2.45B | 213.40M | -199.30M | -52.50M | 53.10M | -96.10M | -522.60M | 241.10M | 92.42M | 14.97M |
| Net Income | 32.00M | 8.00M | 101.10M | -778.40M | 161.20M | 133.40M | -253.80M | 131.40M | -1.07B | -86.57M | 16.19M |
| Net Income Ratio | 0.85% | 0.15% | 2.91% | -32.25% | 10.17% | 9.55% | -24.33% | 14.02% | -100.69% | 0.00% | 0.00% |
| EPS | 0.04 | 0.01 | 0.12 | -22.08 | 3.90 | 3.45 | -9.88 | 5.14 | -42.08 | -1.25 | 0.23 |
| EPS Diluted | 0.04 | 0.01 | 0.12 | -22.08 | 3.57 | 3.09 | -9.88 | 5.14 | -42.08 | -1.25 | 0.23 |
| Weighted Avg Shares Out | 804.00M | 899.80M | 871.20M | 35.25M | 41.31M | 38.70M | 25.69M | 25.54M | 25.54M | 69.00M | 69.00M |
| Weighted Avg Shares Out (Dil) | 806.00M | 912.10M | 872.50M | 35.25M | 45.16M | 43.12M | 25.69M | 25.54M | 25.54M | 69.00M | 69.00M |

Harbour Energy ‘on-track' to complete transformational Wintershall deal later this year

3 International Upstream Stocks Resilient to Industry Uncertainties

Harbour Energy deal materially dilutes UK tax risk, suggests US bank

Harbour Energy deal materially dilutes UK tax risk, suggests US bank

3 UK oil stocks to invest in as Middle East tensions rise

3 UK oil stocks to invest in as Middle East tensions rise

Harbour Energy (HBRIY) JV Confirms Natural Gas Discovery

Harbour Energy reports results ‘in line' as it works to close Wintershall deal

Harbour Energy's $32 mln annual profit curbed by Britain's windfall tax

Should Value Investors Buy Harbour Energy (HBRIY) Stock?
Source: https://incomestatements.info
Category: Stock Reports
