See more : UBS Group AG (0R3T.L) Income Statement Analysis – Financial Results
Complete financial analysis of Hino Motors, Ltd. (HINOY) income statement, including revenue, profit margins, EPS and key performance metrics. Get detailed insights into the financial performance of Hino Motors, Ltd., a leading company in the Auto – Manufacturers industry within the Consumer Cyclical sector.
- Investeringsforeningen Nordea Invest – Global Small Cap Enhanced (NDIGSEKL1.CO) Income Statement Analysis – Financial Results
- Onward Technologies Limited (ONWARDTEC.BO) Income Statement Analysis – Financial Results
- Energold Drilling Corp. (EGDFF) Income Statement Analysis – Financial Results
- Corella Resources Ltd (CR9.AX) Income Statement Analysis – Financial Results
- Snow Peak, Inc. (7816.T) Income Statement Analysis – Financial Results
Hino Motors, Ltd. (HINOY)
About Hino Motors, Ltd.
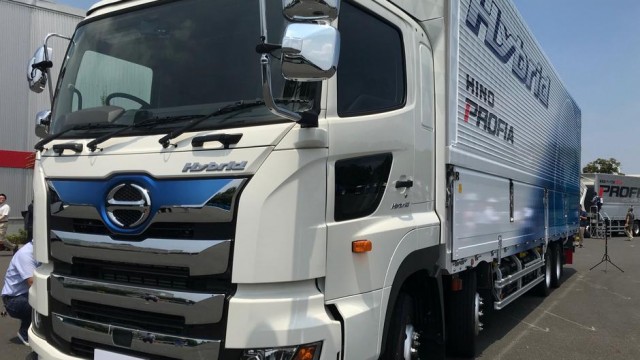
Hino Motors, Ltd. manufactures and sells large commercial vehicles under the Hino brand worldwide. It offers trucks and buses; and light commercial vehicles and passenger vehicles, as well as automotive and industrial diesel engines, vehicle parts, and others. The company was founded in 1910 and is headquartered in Hino, Japan. Hino Motors, Ltd. is a subsidiary of Toyota Motor Corporation.
| Metric | 2024 | 2023 | 2022 | 2021 | 2020 | 2019 | 2018 | 2017 | 2016 | 2015 | 2014 | 2013 | 2012 | 2011 | 2010 | 2009 | 2008 | 2007 | 2006 |
|---|---|---|---|---|---|---|---|---|---|---|---|---|---|---|---|---|---|---|---|
| Revenue | 1,516.26B | 1,507.34B | 1,459.71B | 1,498.44B | 1,815.60B | 1,981.33B | 1,837.98B | 1,683.72B | 1,745.54B | 1,685.30B | 1,699.57B | 1,541.36B | 1,314.59B | 1,242.69B | 1,023.50B | 1,069.49B | 1,368.63B | 1,287.67B | 1,196.97B |
| Cost of Revenue | 1,282.68B | 1,267.68B | 1,209.20B | 1,285.61B | 1,542.43B | 1,674.39B | 1,542.44B | 1,411.09B | 1,450.98B | 1,389.77B | 1,409.50B | 1,314.04B | 1,136.42B | 1,076.30B | 898.97B | 945.13B | 1,172.98B | 1,105.99B | 1,020.99B |
| Gross Profit | 233.58B | 239.66B | 250.51B | 212.83B | 273.17B | 306.94B | 295.54B | 272.63B | 294.56B | 295.53B | 290.07B | 227.32B | 178.16B | 166.39B | 124.53B | 124.36B | 195.66B | 181.67B | 175.99B |
| Gross Profit Ratio | 15.40% | 15.90% | 17.16% | 14.20% | 15.05% | 15.49% | 16.08% | 16.19% | 16.87% | 17.54% | 17.07% | 14.75% | 13.55% | 13.39% | 12.17% | 11.63% | 14.30% | 14.11% | 14.70% |
| Research & Development | 55.28B | 52.55B | 56.70B | 51.36B | 60.57B | 61.49B | 62.61B | 63.06B | 61.00B | 50.14B | 46.25B | 43.35B | 0.00 | 0.00 | 0.00 | 0.00 | 0.00 | 0.00 | 0.00 |
| General & Administrative | 12.83B | 16.09B | 12.59B | 9.74B | 13.09B | 13.77B | 12.95B | 11.88B | 13.82B | 13.02B | 11.68B | 10.78B | 29.66B | 27.07B | 19.49B | 28.31B | 149.77B | 144.97B | 135.46B |
| Selling & Marketing | 8.36B | 9.58B | 8.88B | 22.59B | 31.54B | 34.16B | 32.07B | 29.73B | 28.77B | 24.59B | 24.00B | 18.90B | 14.44B | 11.58B | 8.68B | 11.76B | 14.11B | 0.00 | 0.00 |
| SG&A | 21.19B | 25.66B | 21.47B | 32.33B | 44.63B | 47.93B | 45.02B | 41.61B | 42.60B | 37.62B | 35.67B | 29.68B | 44.10B | 38.65B | 28.18B | 40.07B | 149.77B | 144.97B | 135.46B |
| Other Expenses | 165.21B | 3.72B | 1.64B | 2.13B | -275.00M | -1.32B | 1.53B | 931.00M | 3.36B | 707.00M | 1.78B | 1.44B | 2.98B | 2.00B | 1.44B | 383.00M | 1.00M | 1.00M | 1.00M |
| Operating Expenses | 241.68B | 222.25B | 216.69B | 200.58B | 218.30B | 220.22B | 215.21B | 201.45B | 196.26B | 190.00B | 177.88B | 162.19B | 86.07B | 78.22B | 68.93B | 83.81B | 149.77B | 144.97B | 135.47B |
| Cost & Expenses | 1,524.36B | 1,489.92B | 1,425.89B | 1,486.19B | 1,760.73B | 1,894.61B | 1,757.65B | 1,612.54B | 1,647.25B | 1,579.77B | 1,587.38B | 1,476.23B | 1,222.50B | 1,154.53B | 967.90B | 1,028.94B | 1,322.74B | 1,250.97B | 1,156.45B |
| Interest Income | 2.23B | 1.91B | 1.14B | 1.07B | 1.26B | 1.44B | 1.48B | 1.54B | 1.15B | 1.30B | 1.21B | 931.00M | 1.02B | 1.24B | 1.34B | 1.58B | 1.79B | 7.43B | 6.73B |
| Interest Expense | 11.61B | 6.79B | 2.85B | 4.11B | 6.53B | 5.89B | 4.76B | 4.75B | 6.62B | 6.39B | 5.21B | 3.58B | 3.55B | 3.94B | 4.40B | 5.01B | 10.60B | 7.29B | 5.13B |
| Depreciation & Amortization | 56.48B | 57.29B | 54.96B | 54.75B | 58.01B | 58.54B | 58.56B | 51.10B | 49.31B | 43.96B | 44.52B | 47.28B | 50.08B | 53.03B | 53.36B | 54.47B | 51.08B | 149.00M | -295.00M |
| EBITDA | 111.18B | -25.44B | 26.32B | 67.01B | 112.87B | 145.26B | 138.89B | 122.28B | 147.60B | 149.48B | 156.71B | 116.96B | 71.92B | 73.49B | 51.89B | 24.44B | 93.07B | 86.08B | 40.23B |
| EBITDA Ratio | 7.33% | 5.30% | 6.56% | 4.75% | 6.29% | 7.49% | 7.82% | 7.60% | 8.70% | 9.19% | 9.35% | 7.64% | 10.86% | 11.37% | 10.78% | 8.32% | 6.98% | 2.86% | 3.36% |
| Operating Income | -8.10B | 17.41B | 33.81B | 12.25B | 54.86B | 86.72B | 80.33B | 71.18B | 98.29B | 105.52B | 112.19B | 65.12B | 37.53B | 28.90B | 1.13B | -19.45B | 45.89B | 36.70B | 40.52B |
| Operating Income Ratio | -0.53% | 1.15% | 2.32% | 0.82% | 3.02% | 4.38% | 4.37% | 4.23% | 5.63% | 6.26% | 6.60% | 4.22% | 2.85% | 2.33% | 0.11% | -1.82% | 3.35% | 2.85% | 3.39% |
| Total Other Income/Expenses | 51.19B | -106.93B | -65.29B | -14.13B | -3.89B | -4.19B | 1.39B | 897.00M | -1.41B | -2.29B | 253.00M | 984.00M | -19.24B | -12.38B | -7.00B | -15.59B | -9.00B | -2.16B | 1.82B |
| Income Before Tax | 43.09B | -89.52B | -31.48B | -1.88B | 50.97B | 82.52B | 81.73B | 72.08B | 96.88B | 103.23B | 112.44B | 66.10B | 18.29B | 16.52B | -5.87B | -35.04B | 36.89B | 34.54B | 42.34B |
| Income Before Tax Ratio | 2.84% | -5.94% | -2.16% | -0.13% | 2.81% | 4.17% | 4.45% | 4.28% | 5.55% | 6.13% | 6.62% | 4.29% | 1.39% | 1.33% | -0.57% | -3.28% | 2.70% | 2.68% | 3.54% |
| Income Tax Expense | 17.87B | 18.62B | 46.85B | 4.41B | 16.23B | 21.51B | 23.64B | 17.18B | 28.84B | 24.12B | 14.96B | 12.23B | -2.68B | 21.90B | -5.63B | 26.12B | 13.08B | 13.44B | 12.60B |
| Net Income | 17.09B | -117.66B | -84.73B | -7.49B | 31.47B | 54.91B | 51.36B | 49.41B | 65.13B | 74.50B | 89.13B | 47.69B | 16.30B | -10.04B | -3.01B | -61.84B | 22.18B | 20.06B | 28.70B |
| Net Income Ratio | 1.13% | -7.81% | -5.80% | -0.50% | 1.73% | 2.77% | 2.79% | 2.93% | 3.73% | 4.42% | 5.24% | 3.09% | 1.24% | -0.81% | -0.29% | -5.78% | 1.62% | 1.56% | 2.40% |
| EPS | 29.77 | -204.98 | -147.61 | -13.05 | 54.82 | 956.64 | 895.18 | 861.50 | 1.14K | 1.30K | 1.56K | 835.50 | 286.00 | -176.05 | -52.68 | -1.08K | 386.50 | 349.11 | 499.56 |
| EPS Diluted | 29.77 | -204.98 | -147.61 | -13.05 | 54.82 | 956.64 | 894.90 | 861.10 | 1.14K | 1.30K | 1.55K | 834.20 | 285.90 | -176.05 | -52.68 | -1.08K | 386.50 | 349.11 | 499.56 |
| Weighted Avg Shares Out | 574.03M | 574.03M | 574.03M | 574.03M | 574.02M | 57.40M | 57.38M | 57.35M | 57.32M | 57.28M | 57.21M | 57.08M | 57.00M | 57.03M | 57.16M | 57.33M | 57.39M | 57.46M | 57.46M |
| Weighted Avg Shares Out (Dil) | 574.03M | 574.03M | 574.03M | 574.03M | 574.02M | 57.40M | 57.39M | 57.38M | 57.38M | 57.37M | 57.34M | 57.16M | 57.02M | 57.03M | 57.16M | 57.33M | 57.39M | 57.46M | 57.46M |

Truckmaker Hino expelled from Toyota-led commercial vehicle partnership

Hino Motors shares slide further, drop more than 4% and top loser on Nikkei

Japan's Hino Motors, Toyota accused of misconduct in U.S. lawsuit

Hino Motors: Proxy On Indonesian Economic Recovery
Source: https://incomestatements.info
Category: Stock Reports
