See more : AAA Technologies Limited (AAATECH.NS) Income Statement Analysis – Financial Results
Complete financial analysis of Hikma Pharmaceuticals PLC (HKMPF) income statement, including revenue, profit margins, EPS and key performance metrics. Get detailed insights into the financial performance of Hikma Pharmaceuticals PLC, a leading company in the Drug Manufacturers – Specialty & Generic industry within the Healthcare sector.
- Ruixin International Holdings Limited (0724.HK) Income Statement Analysis – Financial Results
- Meitav DASH Investments Ltd (MTDS.TA) Income Statement Analysis – Financial Results
- Silverlake Axis Ltd (5CP.SI) Income Statement Analysis – Financial Results
- Hota Industrial Mfg. Co., Ltd. (1536.TW) Income Statement Analysis – Financial Results
- Thai Oil Public Company Limited (TOP-R.BK) Income Statement Analysis – Financial Results
Hikma Pharmaceuticals PLC (HKMPF)
About Hikma Pharmaceuticals PLC
Hikma Pharmaceuticals PLC develops, manufactures, markets, and sells a range of generic, branded, and in-licensed pharmaceutical products. The company offers its products in solid, semi-solid, liquid, and injectable final dosage forms. It operates through three segments: Injectables, Generics, and Branded. The Injectables segment provides generic injectable products primarily for use in hospitals. The Generics segment offers oral and other non-injectable generic products for the retail market. The Branded segment offers branded generics and in-licensed products to retail and hospital markets. The company provides its products in various therapeutic areas, including anti-infective, cardiovascular, central nervous system, diabetes, oncology, pain management, and respiratory. It operates in the United Kingdom, the United States, the Middle East, North Africa, Europe, and internationally. The company was founded in 1978 and is based in London, the United Kingdom.
| Metric | 2023 | 2022 | 2021 | 2020 | 2019 | 2018 | 2017 | 2016 | 2015 | 2014 | 2013 | 2012 | 2011 | 2010 | 2009 | 2008 | 2007 | 2006 | 2005 | 2004 | 2003 | 2002 |
|---|---|---|---|---|---|---|---|---|---|---|---|---|---|---|---|---|---|---|---|---|---|---|
| Revenue | 2.88B | 2.52B | 2.55B | 2.34B | 2.21B | 2.07B | 1.94B | 1.95B | 1.44B | 1.49B | 1.37B | 1.11B | 918.03M | 730.94M | 636.88M | 580.66M | 448.80M | 317.02M | 262.22M | 212.38M | 105.15M | 85.50M |
| Cost of Revenue | 1.47B | 1.28B | 1.25B | 1.14B | 1.06B | 1.02B | 969.00M | 964.00M | 622.00M | 638.00M | 601.00M | 607.60M | 522.68M | 373.59M | 332.46M | 324.17M | 227.26M | 158.49M | 126.42M | 103.94M | 51.57M | 40.58M |
| Gross Profit | 1.41B | 1.24B | 1.30B | 1.20B | 1.15B | 1.05B | 967.00M | 986.00M | 818.00M | 851.00M | 764.00M | 501.12M | 395.35M | 357.34M | 304.43M | 256.48M | 221.53M | 158.53M | 135.79M | 108.44M | 53.58M | 44.92M |
| Gross Profit Ratio | 48.94% | 49.19% | 50.96% | 51.30% | 52.02% | 50.72% | 49.95% | 50.56% | 56.81% | 57.15% | 55.97% | 45.20% | 43.07% | 48.89% | 47.80% | 44.17% | 49.36% | 50.01% | 51.79% | 51.06% | 50.96% | 52.54% |
| Research & Development | 149.00M | 144.00M | 143.00M | 137.00M | 150.00M | 147.00M | 115.00M | 150.00M | 36.00M | 55.00M | 39.00M | 34.02M | 31.22M | 23.61M | 16.84M | 22.17M | 19.34M | 18.29M | 16.51M | 9.67M | 4.13M | 3.01M |
| General & Administrative | 638.00M | 509.00M | 488.00M | 464.00M | 453.00M | 246.00M | 238.00M | 208.00M | 180.00M | 185.00M | 151.00M | 124.56M | -43.12M | -29.85M | -38.86M | -47.35M | -17.67M | -4.96M | -4.76M | -4.63M | 0.00 | 0.00 |
| Selling & Marketing | 0.00 | 0.00 | 0.00 | 0.00 | 494.00M | 224.00M | 188.00M | 184.00M | 156.00M | 171.00M | 160.00M | 152.76M | 125.30M | 106.67M | 98.08M | 90.56M | 61.02M | 35.01M | 27.37M | 19.73M | 0.00 | 0.00 |
| SG&A | 638.00M | 509.00M | 488.00M | 464.00M | 494.00M | 470.00M | 426.00M | 392.00M | 336.00M | 356.00M | 311.00M | 277.32M | 82.17M | 76.83M | 59.23M | 43.21M | 43.35M | 30.05M | 22.61M | 15.10M | 0.00 | 0.00 |
| Other Expenses | 253.00M | 0.00 | 0.00 | 0.00 | -50.88M | -59.22M | -60.92M | -88.83M | -54.02M | 0.00 | 0.00 | -1.17M | 2.33M | 0.00 | 0.00 | 0.00 | 0.00 | 938.00K | 1.45M | 732.00K | 0.00 | 0.00 |
| Operating Expenses | 1.04B | 756.00M | 742.00M | 687.00M | 655.00M | 690.00M | 635.00M | 611.00M | 401.00M | 449.00M | 412.00M | 334.34M | 276.73M | 222.04M | 197.80M | 176.64M | 129.34M | 84.16M | 67.59M | 46.06M | 22.62M | 20.29M |
| Cost & Expenses | 2.51B | 2.04B | 1.99B | 1.83B | 1.71B | 1.71B | 1.60B | 1.58B | 1.02B | 1.09B | 1.01B | 941.95M | 799.41M | 595.63M | 530.26M | 500.81M | 356.60M | 242.65M | 194.02M | 150.00M | 74.19M | 60.87M |
| Interest Income | 7.00M | 3.00M | 30.00M | 47.00M | 67.00M | 3.00M | 2.00M | 12.00M | 3.00M | 4.00M | 2.00M | 1.27M | 468.00K | 346.00K | 514.00K | 817.00K | 2.03M | 5.26M | 1.56M | 326.00K | 290.00K | 117.00K |
| Interest Expense | 90.00M | 77.00M | 69.00M | 69.00M | 67.00M | 80.00M | 60.00M | 104.00M | 57.00M | 38.00M | 37.00M | 35.72M | 23.37M | 13.86M | 12.83M | 17.55M | 10.84M | 4.96M | 5.21M | 3.83M | 1.90M | 2.55M |
| Depreciation & Amortization | 195.60M | 186.55M | 164.15M | 143.91M | 121.49M | 104.11M | 142.86M | 102.57M | 73.00M | 72.00M | 75.00M | 58.39M | 47.00M | 38.43M | 34.15M | 33.12M | 23.43M | 13.80M | 10.33M | 6.77M | 3.06M | 4.89M |
| EBITDA | 572.47M | 485.00M | 735.00M | 796.28M | 685.36M | 435.55M | -570.38M | 350.74M | 484.00M | 472.00M | 426.00M | 226.15M | 164.19M | 165.38M | 141.10M | 114.47M | 117.32M | 94.35M | 79.70M | 70.01M | 34.64M | 28.71M |
| EBITDA Ratio | 19.91% | 27.81% | 28.79% | 27.85% | 29.86% | 23.38% | 81.35% | 27.33% | 33.61% | 31.70% | 31.21% | 20.40% | 17.89% | 23.73% | 22.15% | 19.61% | 26.26% | 29.78% | 31.20% | 32.97% | 32.91% | 33.58% |
| Operating Income | 367.00M | 282.00M | 582.00M | 579.00M | 493.00M | 371.00M | -747.00M | 302.00M | 381.00M | 402.00M | 352.00M | 166.77M | 118.69M | 135.10M | 107.29M | 80.68M | 92.40M | 75.25M | 69.21M | 62.72M | 30.99M | 22.46M |
| Operating Income Ratio | 12.77% | 11.20% | 22.80% | 24.73% | 22.34% | 17.92% | -38.58% | 15.49% | 26.46% | 27.00% | 25.79% | 15.04% | 12.93% | 18.48% | 16.85% | 13.89% | 20.59% | 23.74% | 26.39% | 29.53% | 29.47% | 26.27% |
| Total Other Income/Expenses | -86.00M | -49.00M | -38.00M | -21.00M | -2.00M | -78.00M | 9.00M | -92.00M | -63.00M | -40.00M | -54.00M | -35.00M | -24.80M | -14.11M | -12.51M | -16.65M | -8.61M | 348.60K | -4.80M | -3.70M | -1.32M | -3.37M |
| Income Before Tax | 281.00M | 233.00M | 544.00M | 558.00M | 491.00M | 293.00M | -738.00M | 210.00M | 318.00M | 362.00M | 298.00M | 132.04M | 93.89M | 120.98M | 94.79M | 64.03M | 83.79M | 75.60M | 64.41M | 59.02M | 29.67M | 19.10M |
| Income Before Tax Ratio | 9.77% | 9.26% | 21.31% | 23.84% | 22.25% | 14.15% | -38.12% | 10.77% | 22.08% | 24.31% | 21.83% | 11.91% | 10.23% | 16.55% | 14.88% | 11.03% | 18.67% | 23.85% | 24.56% | 27.79% | 28.22% | 22.33% |
| Income Tax Expense | 89.00M | 42.00M | 124.00M | 128.00M | 4.00M | 8.00M | 101.00M | 52.00M | 64.00M | 80.00M | 82.00M | 24.83M | 10.42M | 21.46M | 15.47M | 6.92M | 19.60M | 19.64M | 19.45M | 20.84M | 11.91M | 8.52M |
| Net Income | 190.00M | 188.00M | 421.00M | 431.00M | 486.00M | 282.00M | -843.00M | 155.00M | 252.00M | 278.00M | 212.00M | 100.00M | 80.11M | 98.85M | 77.68M | 57.12M | 62.58M | 54.52M | 43.87M | 37.46M | 17.59M | 10.50M |
| Net Income Ratio | 6.61% | 7.47% | 16.49% | 18.41% | 22.02% | 13.62% | -43.54% | 7.95% | 17.50% | 18.67% | 15.53% | 9.02% | 8.73% | 13.52% | 12.20% | 9.84% | 13.94% | 17.20% | 16.73% | 17.64% | 16.73% | 12.28% |
| EPS | 0.86 | 0.82 | 1.79 | 1.95 | 2.09 | 1.17 | -3.51 | 0.67 | 1.27 | 1.40 | 1.08 | 0.51 | 0.41 | 0.51 | 0.41 | 0.30 | 0.37 | 0.33 | 0.30 | 26.30 | 0.11 | 0.06 |
| EPS Diluted | 0.85 | 0.82 | 1.78 | 1.93 | 2.08 | 1.17 | -3.50 | 0.66 | 1.25 | 1.39 | 1.07 | 0.51 | 0.41 | 0.50 | 0.40 | 0.30 | 0.35 | 0.31 | 0.28 | 24.80 | 0.11 | 0.06 |
| Weighted Avg Shares Out | 220.86M | 224.00M | 231.00M | 236.00M | 242.00M | 241.00M | 240.00M | 233.00M | 199.00M | 198.00M | 197.00M | 196.35M | 194.14M | 192.30M | 189.76M | 187.88M | 169.22M | 167.28M | 154.86M | 166.54M | 166.54M | 166.54M |
| Weighted Avg Shares Out (Dil) | 222.37M | 225.00M | 233.00M | 238.00M | 243.00M | 242.00M | 241.00M | 234.00M | 201.00M | 200.00M | 198.00M | 198.30M | 197.77M | 196.86M | 193.73M | 193.17M | 176.85M | 175.92M | 154.86M | 166.54M | 166.54M | 166.54M |

U.K. Dividend Stocks Portfolio: 2023 Year-End Review
Hikma Pharmaceuticals upgrades guidance for all segments except injectables

Selling Hikma Pharmaceuticals After A 40% Share Price Gain In 7 Months

Hikma Pharmaceuticals PLC (HKMPF) Q4 2022 Earnings Call Transcript
Hikma Pharmaceuticals higher as Citi analysts revise target price
Hikma Pharmaceuticals launches generic version of narcolepsy treatment Xyrem in US

Hikma Pharmaceuticals Plc (HKMPF) 2022 Interim Results - Earnings Call Transcript
Hikma Pharmaceuticals loses CEO

Hikma Pharmaceuticals PLC (HKMPF) CEO Sigurdur Olafsson on Q4 2021 Results - Earnings Call Transcript
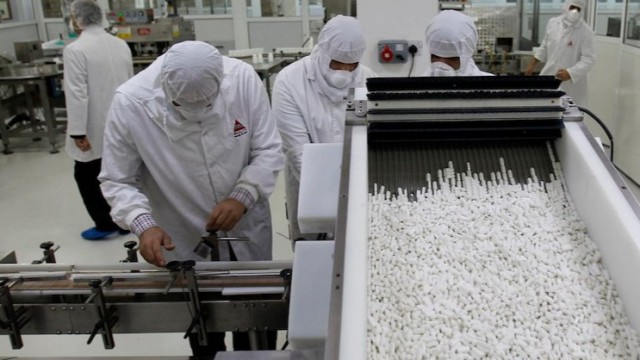
Hikma Pharmaceuticals sales grow 9%, announces US$300mln share buyback
Source: https://incomestatements.info
Category: Stock Reports
