See more : DNB Bank ASA (DNBBF) Income Statement Analysis – Financial Results
Complete financial analysis of Pioneer Diversified High Income Fund, Inc. (HNW) income statement, including revenue, profit margins, EPS and key performance metrics. Get detailed insights into the financial performance of Pioneer Diversified High Income Fund, Inc., a leading company in the Asset Management – Income industry within the Financial Services sector.
- Telescope Innovations Corp. (TELIF) Income Statement Analysis – Financial Results
- Orchid Ventures, Inc. (ORCD.CN) Income Statement Analysis – Financial Results
- Caterpillar Inc. (CATR.PA) Income Statement Analysis – Financial Results
- Medios AG (ILM1.DE) Income Statement Analysis – Financial Results
- FAWER Automotive Parts Limited Company (200030.SZ) Income Statement Analysis – Financial Results
Pioneer Diversified High Income Fund, Inc. (HNW)
Industry: Asset Management - Income
Sector: Financial Services
About Pioneer Diversified High Income Fund, Inc.
Pioneer Diversified High Income Fund, Inc. is a closed ended fixed income mutual fund launched and managed by Pioneer Investment Management, Inc. It invests in the fixed income markets across the globe. The fund seeks to invest in higher yielding asset classes, including high yield bonds, leveraged bank loans, and event-linked bonds .It employs a combination of fundamental and quantitative analysis to create its portfolio. The fund benchmarks the performance of its portfolio against a composite benchmark comprising of 50% Bank of America Merrill Lynch Global High Yield, Emerging Markets Plus Index and 50% the Credit Suisse Leveraged Loan Index. Pioneer Diversified High Income Fund, Inc. was formed on January 30, 2007 and is domiciled in the United States.
| Metric | 2023 | 2022 | 2021 | 2020 | 2019 | 2018 | 2017 | 2016 | 2015 | 2014 | 2013 | 2012 | 2011 | 2010 |
|---|---|---|---|---|---|---|---|---|---|---|---|---|---|---|
| Revenue | 16.12M | -5.05M | -6.02M | 37.25M | -19.70M | 2.30M | 5.94M | 21.21M | -1.85M | 2.00M | 13.76M | 27.26M | 4.19M | 23.44M |
| Cost of Revenue | 8.75M | 1.37M | 1.74M | 24.33M | 1.82M | 1.83M | 1.93M | 1.89M | 1.91M | 0.00 | 0.00 | 0.00 | 0.00 | 0.00 |
| Gross Profit | 7.37M | -6.42M | -7.76M | 12.92M | -21.52M | 461.54K | 4.01M | 19.32M | -3.76M | 2.00M | 13.76M | 27.26M | 4.19M | 23.44M |
| Gross Profit Ratio | 45.70% | 127.14% | 128.90% | 34.69% | 109.25% | 20.11% | 67.44% | 91.08% | 203.64% | 100.00% | 100.00% | 100.00% | 100.00% | 100.00% |
| Research & Development | 0.00 | 0.00 | -0.51 | 4.75 | -3.14 | 0.00 | 0.00 | 0.00 | 0.00 | 0.00 | 0.00 | 0.00 | 0.00 | 0.00 |
| General & Administrative | 589.21K | 344.76K | 407.39K | 438.66K | 361.33K | 300.74K | 362.05K | 429.57K | 355.64K | 341.21K | 342.43K | 450.82K | 418.55K | 725.40K |
| Selling & Marketing | 0.00 | 0.00 | 0.00 | 0.00 | 0.00 | 0.00 | 0.00 | 0.00 | 0.00 | 0.00 | 0.00 | 0.00 | 0.00 | 0.00 |
| SG&A | 589.21K | 344.76K | 407.39K | 438.66K | 361.33K | 300.74K | 362.05K | 429.57K | 355.64K | 341.21K | 342.43K | 450.82K | 418.55K | 725.40K |
| Other Expenses | 15.53M | 0.00 | 14.27K | 14.57K | 11.68K | 13.74K | 17.02K | 14.27K | 4.27K | 5.19K | 8.78K | 16.81K | 12.60K | -15.05K |
| Operating Expenses | 16.12M | 360.58K | 421.67K | 453.24K | 373.01K | 314.48K | 379.06K | 443.84K | 359.91K | 346.40K | 351.21K | 467.63K | 431.15K | 710.36K |
| Cost & Expenses | 16.12M | 16.43M | 19.15M | 24.43M | 32.00M | 10.10M | 379.06K | 443.84K | 359.91K | 346.40K | 351.21K | 467.63K | 431.15K | 710.36K |
| Interest Income | 12.63M | 11.95M | 12.77M | 11.79M | 12.98M | 12.54M | 13.81M | 13.68M | 15.46M | 17.78M | 19.39M | 21.64M | 20.33M | 20.02M |
| Interest Expense | 2.73M | 1.84M | 665.53K | 560.78K | 1.76M | 2.02M | 1.55M | 892.66K | 712.82K | 681.00K | 743.79K | 784.52K | 902.24K | 959.94K |
| Depreciation & Amortization | 18.49K | -11.25M | -11.36M | -10.96M | -11.70M | -12.09M | -11.82M | -11.67M | 712.82K | 681.00K | 743.79K | 784.52K | 902.24K | 959.94K |
| EBITDA | 18.22M | -3.90M | -5.74M | 26.38M | -20.16M | -10.11M | -6.26M | 0.00 | 989.04K | 0.00 | 0.00 | 0.00 | 0.00 | 0.00 |
| EBITDA Ratio | 113.04% | 330.02% | 295.63% | 69.35% | 161.30% | -440.48% | 119.64% | 102.12% | 80.89% | 116.71% | 102.85% | 101.16% | 111.25% | 101.06% |
| Operating Income | 18.22M | 11.25M | 11.36M | 10.96M | 11.70M | 12.09M | 7.11M | 21.66M | -2.21M | 1.66M | 13.41M | 26.79M | 3.76M | 22.73M |
| Operating Income Ratio | 113.04% | -222.88% | -188.63% | 29.43% | -59.40% | 526.78% | 119.64% | 102.12% | 119.49% | 82.70% | 97.45% | 98.28% | 89.70% | 96.97% |
| Total Other Income/Expenses | -2.71M | 16.07M | 1.07M | 25.83M | 63.39K | -183.80K | -6.26M | 497.50K | 0.00 | 0.00 | 0.00 | 0.00 | 0.00 | 0.00 |
| Income Before Tax | 15.51M | -5.41M | -6.44M | 36.80M | -20.07M | 1.98M | 5.56M | 20.76M | -2.21M | 1.66M | 13.41M | 26.79M | 3.76M | 22.73M |
| Income Before Tax Ratio | 96.23% | 107.14% | 107.00% | 98.78% | 101.89% | 86.30% | 93.62% | 97.91% | 119.49% | 82.70% | 97.45% | 98.28% | 89.70% | 96.97% |
| Income Tax Expense | 0.00 | -16.67M | -17.80M | 25.83M | -31.77M | -10.11M | 11.82M | 11.67M | -989.04K | -14.20M | -3.80M | 7.48M | 0.00 | 0.00 |
| Net Income | 15.51M | -5.41M | -6.44M | 36.80M | -20.07M | 1.98M | 5.56M | 20.76M | -2.21M | 1.66M | 13.41M | 26.79M | 3.76M | 22.73M |
| Net Income Ratio | 96.23% | 107.14% | 107.00% | 98.78% | 101.89% | 86.30% | 93.62% | 97.91% | 119.49% | 82.70% | 97.45% | 98.28% | 89.70% | 96.97% |
| EPS | 1.86 | -0.65 | -0.77 | 4.42 | -2.41 | 0.24 | 0.67 | 2.49 | -0.26 | 0.19 | 1.62 | 3.23 | 0.45 | 2.76 |
| EPS Diluted | 1.86 | -0.65 | -0.77 | 4.42 | -2.41 | 0.24 | 0.67 | 2.49 | -0.26 | 0.19 | 1.62 | 3.23 | 0.45 | 2.76 |
| Weighted Avg Shares Out | 8.33M | 8.32M | 8.33M | 8.33M | 8.33M | 8.33M | 8.30M | 8.33M | 8.33M | 8.33M | 8.28M | 8.29M | 8.26M | 8.23M |
| Weighted Avg Shares Out (Dil) | 8.33M | 8.33M | 8.33M | 8.33M | 8.33M | 8.33M | 8.30M | 8.34M | 8.49M | 8.72M | 8.28M | 8.30M | 8.26M | 8.23M |

Equities Analysts Issue Forecasts for Redfin Corp’s FY2021 Earnings (NASDAQ:RDFN)

Q2 2020 Earnings Forecast for Papa John’s Int’l, Inc. Issued By Oppenheimer (NASDAQ:PZZA)

Analysts Anticipate Mammoth Energy Services Inc (NASDAQ:TUSK) to Post -$0.49 Earnings Per Share

Irhythm Technologies Inc (NASDAQ:IRTC) Expected to Post Earnings of -$0.84 Per Share

Global Payments (NYSE:GPN) PT Raised to $202.00

BTIG Research Raises Papa John’s Int’l (NASDAQ:PZZA) Price Target to $95.00

Skandinaviska Enskilda Banken AB publ Reduces Stock Position in Keurig Dr Pepper Inc (NYSE:KDP)

LogMeIn Inc (NASDAQ:LOGM) Shares Acquired by New Mexico Educational Retirement Board
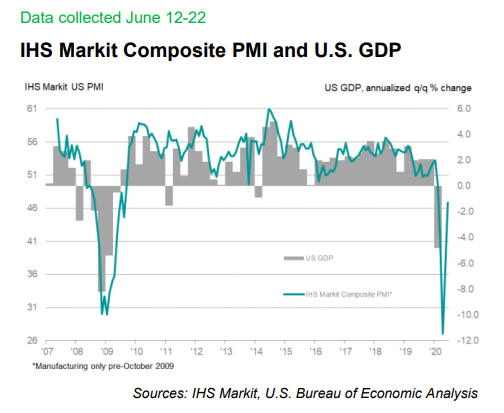
The Reopening Killed The V-Shaped Recovery
The Chemist's Quality Closed-End Fund Report: June 2020
Source: https://incomestatements.info
Category: Stock Reports
