See more : Alps Logistics Co., Ltd. (9055.T) Income Statement Analysis – Financial Results
Complete financial analysis of Harvest Health & Recreation Inc. (HRVSF) income statement, including revenue, profit margins, EPS and key performance metrics. Get detailed insights into the financial performance of Harvest Health & Recreation Inc., a leading company in the Drug Manufacturers – Specialty & Generic industry within the Healthcare sector.
- Mitsui & Co., Ltd. (MITSF) Income Statement Analysis – Financial Results
- BlackRock MuniYield Fund, Inc. (MYD) Income Statement Analysis – Financial Results
- Inter State Oil Carrier Limited (INTSTOIL.BO) Income Statement Analysis – Financial Results
- Tianjin MOTIMO Membrane Technology Co.,Ltd (300334.SZ) Income Statement Analysis – Financial Results
- SENA J Property Public Company Limited (SENAJ.BK) Income Statement Analysis – Financial Results
Harvest Health & Recreation Inc. (HRVSF)
Industry: Drug Manufacturers - Specialty & Generic
Sector: Healthcare
Website: http://www.harvesthoc.com
About Harvest Health & Recreation Inc.
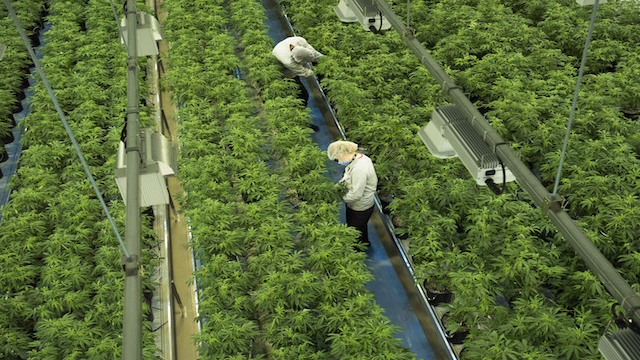
Harvest Health and Recreation, Inc., together with its subsidiaries, cultivates, processes, sells, and retails inhalable, ingestible, and topical cannabis products in the United States. The company offers cannabis oil products; inhalables, including flower, dabbable concentrates, pre-filled vaporizer pens, and cartridges; and capsules, tinctures, and cannabis product edibles, including chocolates, gummies, mints, fruit chews, and dissolvable mouth strips under the Avenue, CBX SCIENCES, EVOLAB, ALCHEMY, CHROMA, CO2LORS, GOODSUN, MODERN FLOWER, and ROLL ONE brand names. It also operates retail dispensaries that sell proprietary and third-party cannabis products to patients and customers; and provides support services and financing to a Utah licensed medical cannabis cultivator. Harvest Health and Recreation, Inc. was founded in 2011 and is headquartered in Tempe, Arizona.
| Metric | 2020 | 2019 | 2018 | 2017 | 2016 | 2015 | 2014 | 2013 | 2012 | 2011 | 2010 | 2009 | 2008 |
|---|---|---|---|---|---|---|---|---|---|---|---|---|---|
| Revenue | 231.46M | 116.78M | 77.79K | 200.29K | 284.45K | 482.02K | 675.22K | 368.83K | 292.64K | 233.88K | 180.62K | 147.97K | 24.10K |
| Cost of Revenue | 129.87M | 73.21M | 15.89K | 56.47K | 31.73K | 94.81K | 160.79K | 51.74K | 269.58K | 478.39K | 372.72K | 1.23M | 14.92K |
| Gross Profit | 101.59M | 43.57M | 61.91K | 143.82K | 252.72K | 387.20K | 514.43K | 317.09K | 23.05K | -244.51K | -192.10K | -1.08M | 9.18K |
| Gross Profit Ratio | 43.89% | 37.31% | 79.58% | 71.81% | 88.84% | 80.33% | 76.19% | 85.97% | 7.88% | -104.55% | -106.36% | -728.50% | 38.10% |
| Research & Development | 0.00 | 0.00 | 0.00 | 0.00 | 0.00 | 0.00 | 0.00 | 0.00 | 0.00 | 0.00 | 0.00 | 0.00 | 0.00 |
| General & Administrative | 122.10M | 115.86M | 83.35K | 65.96K | 78.32K | 129.18K | 251.07K | 246.79K | 446.60K | 505.30K | 498.98K | 498.25K | 0.00 |
| Selling & Marketing | 4.96M | 8.94M | 0.00 | 0.00 | 0.00 | 0.00 | 1.40K | 0.00 | 1.26K | 0.00 | 10.93K | 0.00 | 0.00 |
| SG&A | 127.06M | 124.80M | 83.35K | 65.96K | 78.32K | 129.18K | 252.46K | 246.79K | 447.86K | 505.30K | 509.91K | 498.25K | 0.00 |
| Other Expenses | 7.92M | 10.30M | 93.75K | 126.55K | 300.84K | 408.79K | 308.00K | 180.03K | 55.80K | 0.00 | 0.00 | 0.00 | 1.46M |
| Operating Expenses | 134.98M | 135.10M | 177.10K | 192.51K | 379.15K | 537.97K | 560.47K | 426.82K | 503.65K | 505.30K | 509.91K | 498.25K | 1.46M |
| Cost & Expenses | 264.85M | 208.30M | 192.98K | 248.98K | 410.89K | 632.79K | 721.26K | 478.56K | 773.24K | 983.69K | 882.64K | 1.72M | 1.48M |
| Interest Income | 444.00K | 0.00 | 0.00 | 0.00 | 0.00 | 0.00 | 60.03 | 615.56 | 568.96 | 1.21K | 1.98K | 9.68K | 1.53K |
| Interest Expense | 39.06M | 16.24M | 4.78K | 5.50K | 3.34K | 5.27K | 6.99K | 10.34K | 32.61K | 27.68K | 16.64K | 2.28K | 0.00 |
| Depreciation & Amortization | 16.67M | 12.69M | 2.93K | 5.22K | 3.29K | 13.51K | 24.44K | 6.09K | 55.80K | 200.11K | 165.86K | 991.47K | 651.57K |
| EBITDA | -259.00K | -140.80M | -347.62K | -43.47K | -109.40K | -110.67K | -219.74K | -125.25K | -25.86K | -645.52K | -1.56M | -575.04K | -801.24K |
| EBITDA Ratio | -0.11% | -120.57% | -446.85% | -21.71% | -38.46% | -22.96% | -32.54% | -33.96% | -8.84% | -276.01% | -866.36% | -388.63% | -3,324.16% |
| Operating Income | -33.39M | -91.52M | -115.19K | -48.69K | -126.44K | -150.77K | -46.04K | -109.73K | -480.60K | -749.81K | -702.02K | -1.58M | -1.45M |
| Operating Income Ratio | -14.43% | -78.37% | -148.07% | -24.31% | -44.45% | -31.28% | -6.82% | -29.75% | -164.23% | -320.60% | -388.67% | -1,065.22% | -6,033.34% |
| Total Other Income/Expenses | -21.26M | -80.29M | -240.14K | -5.50K | 10.40K | 21.32K | -205.13K | -31.96K | 366.34K | -97.03K | -933.72K | 0.00 | 0.00 |
| Income Before Tax | -54.65M | -171.81M | -355.33K | -54.19K | -116.04K | -129.45K | -251.17K | -141.69K | -114.26K | -846.84K | -1.64M | 0.00 | 0.00 |
| Income Before Tax Ratio | -23.61% | -147.12% | -456.76% | -27.06% | -40.79% | -26.86% | -37.20% | -38.42% | -39.05% | -362.08% | -905.63% | 0.00% | 0.00% |
| Income Tax Expense | 3.65M | 3.76M | -235.36K | 0.00 | 13.75K | 26.59K | -198.14K | -21.61K | 398.95K | -69.35K | -917.09K | 2.28K | 0.00 |
| Net Income | -59.63M | -173.49M | -355.33K | -54.19K | -116.04K | -129.45K | -251.17K | -141.69K | -114.26K | -873.31K | -1.75M | -1.57M | -1.45M |
| Net Income Ratio | -25.76% | -148.56% | -456.76% | -27.06% | -40.79% | -26.86% | -37.20% | -38.42% | -39.05% | -373.40% | -967.40% | -1,060.22% | -6,027.36% |
| EPS | -0.17 | -0.61 | -0.08 | -0.01 | -0.03 | -0.03 | -0.06 | -0.04 | -0.04 | -0.42 | -1.23 | -1.53 | -3.86 |
| EPS Diluted | -0.17 | -0.61 | -0.08 | -0.01 | -0.03 | -0.03 | -0.06 | -0.04 | -0.04 | -0.42 | -1.23 | -1.53 | -3.86 |
| Weighted Avg Shares Out | 354.76M | 286.63M | 4.59M | 4.00M | 4.00M | 4.00M | 3.95M | 3.22M | 2.79M | 2.09M | 1.43M | 1.03M | 376.52K |
| Weighted Avg Shares Out (Dil) | 354.76M | 286.63M | 4.59M | 4.00M | 4.00M | 4.00M | 3.95M | 3.22M | 2.79M | 2.09M | 1.43M | 1.03M | 376.52K |

Should You Be Buying These Marijuana Stocks During This Decline In The Market?

Alabama Legalizes Medical Marijuana

Is Trulieve a Must-Buy After Announcing Plans to Acquire Harvest Health?

SHAREHOLDER ALERT: Monteverde & Associates PC Announces an Investigation of Harvest Health & Recreation, Inc. - HRVSF

HARVEST HEALTH INVESTOR ALERT by the Former Attorney General of Louisiana: Kahn Swick & Foti, LLC Investigates Adequacy of Price and Process in Proposed Sale of Harvest Health & Recreation Inc. - HRVSF

Analyst: Trulieve's Harvest Merger Wouldn't Have Been Cantor's 'First Choice' But It Brings More Value Than Just Assets

Harvest Health Merger Investigation: Halper Sadeh LLP Announces Investigation Into Whether the Sale of Harvest Health & Recreation Inc. Is Fair to Shareholders; Investors Are Encouraged to Contact the Firm – HRVSF

Trulieve Cannabis Acquiring Harvest Health & Recreation in $2.1 Billion Deal

These Marijuana Companies Are Now The Biggest In The World

SHAREHOLDER ALERT: WeissLaw LLP Investigates Harvest Health & Recreation Inc.
Source: https://incomestatements.info
Category: Stock Reports
