See more : Regenicin, Inc. (RGIN) Income Statement Analysis – Financial Results
Complete financial analysis of Hesai Group (HSAI) income statement, including revenue, profit margins, EPS and key performance metrics. Get detailed insights into the financial performance of Hesai Group, a leading company in the Auto – Parts industry within the Consumer Cyclical sector.
- BAIC Motor Corporation Limited (BCCMY) Income Statement Analysis – Financial Results
- NuCana plc (NCNA) Income Statement Analysis – Financial Results
- Hongbo Co., Ltd. (002229.SZ) Income Statement Analysis – Financial Results
- Kleos Space S.A. (KSS.AX) Income Statement Analysis – Financial Results
- Yasho Industries Limited (YASHO.NS) Income Statement Analysis – Financial Results
Hesai Group (HSAI)
About Hesai Group
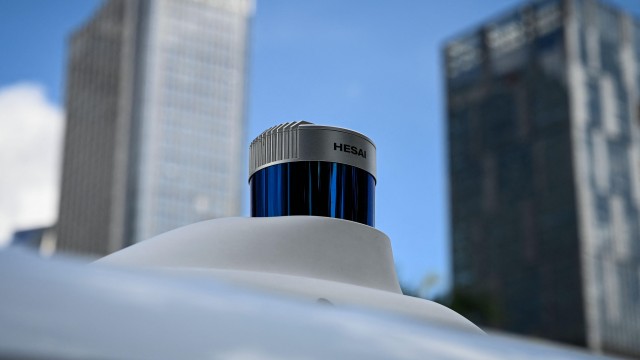
Hesai Group, through with its subsidiaries, engages in the development, manufacture, and sale of three-dimensional light detection and ranging solutions (LiDAR). Its LiDAR products are used in passenger and commercial vehicles with advanced driver assistance systems; autonomous passenger and freight mobility services; and other applications, such as delivery robots, street sweeping robots, and logistics robots in restricted areas. Hesai Group was founded in 2014 and is based in Shanghai, China.
| Metric | 2023 | 2022 | 2021 | 2020 | 2019 |
|---|---|---|---|---|---|
| Revenue | 1.88B | 1.20B | 720.77M | 415.51M | 348.08M |
| Cost of Revenue | 1.22B | 730.68M | 338.97M | 176.60M | 103.38M |
| Gross Profit | 661.38M | 471.99M | 381.80M | 238.91M | 244.71M |
| Gross Profit Ratio | 35.24% | 39.24% | 52.97% | 57.50% | 70.30% |
| Research & Development | 790.55M | 555.18M | 368.44M | 229.65M | 149.82M |
| General & Administrative | 320.14M | 201.01M | 236.71M | 76.55M | 55.11M |
| Selling & Marketing | 148.80M | 104.84M | 69.27M | 49.90M | 38.74M |
| SG&A | 468.94M | 305.84M | 305.98M | 126.46M | 93.85M |
| Other Expenses | -26.52M | -10.82M | -27.33M | -15.38M | -11.01M |
| Operating Expenses | 1.23B | 850.20M | 647.08M | 340.73M | 232.66M |
| Cost & Expenses | 2.45B | 1.58B | 986.05M | 517.33M | 336.04M |
| Interest Income | 99.81M | 58.73M | 32.58M | 20.93M | 19.11M |
| Interest Expense | 3.07M | 0.00 | 0.00 | 0.00 | 0.00 |
| Depreciation & Amortization | 86.27M | 53.63M | 28.23M | 19.22M | 9.72M |
| EBITDA | -385.93M | -247.15M | -217.63M | -82.60M | 21.77M |
| EBITDA Ratio | -20.56% | -33.18% | -31.05% | -13.69% | 49.49% |
| Operating Income | -571.59M | -378.22M | -265.29M | -101.81M | 162.53M |
| Operating Income Ratio | -30.45% | -31.45% | -36.81% | -24.50% | 46.69% |
| Total Other Income/Expenses | 96.28M | 77.39M | 19.34M | -5.60M | 28.76M |
| Income Before Tax | -475.31M | -300.83M | -245.94M | -107.42M | -119.29M |
| Income Before Tax Ratio | -25.32% | -25.01% | -34.12% | -25.85% | -34.27% |
| Income Tax Expense | 658.00K | -66.00K | -1.12M | -199.00K | 930.00K |
| Net Income | -475.97M | -300.77M | -244.83M | -107.22M | -120.22M |
| Net Income Ratio | -25.36% | -25.01% | -33.97% | -25.80% | -34.54% |
| EPS | -3.81 | -2.40 | -1.95 | -0.85 | -0.96 |
| EPS Diluted | -3.81 | -2.40 | -1.95 | -0.85 | -0.96 |
| Weighted Avg Shares Out | 124.78M | 125.53M | 125.53M | 125.53M | 125.53M |
| Weighted Avg Shares Out (Dil) | 124.78M | 125.53M | 125.53M | 125.53M | 125.53M |

Hesai Secures ADAS Lidar Design Win for Multiple New Vehicles with SAIC Motor

7 Growth Stocks That Could Double Your Money in 2023

Hesai Group: A Mixed View

Hesai Group to Report First Quarter 2023 Financial Results on Tuesday, May 23, 2023

Lidar tech company Ouster sues Hesai Group over patents

Bottom Of The Lidar Barrel: Companies To Avoid

Hesai Group to Report Fourth Quarter and Full Year 2022 Financial Results on Wednesday, March 15, 2023

China's Hesai Group Climbs In Nasdaq Debut On Autonomous Transport Hopes
IPOs ride stock-market surge with debuts from Nextracker, Hesai Group and others

Hesai Group IPO: The Risk Of Chinese IPOs
Source: https://incomestatements.info
Category: Stock Reports
