See more : The Narragansett Electric Company PFD 4.50% (NRGSP) Income Statement Analysis – Financial Results
Complete financial analysis of Invinity Energy Systems plc (IESVF) income statement, including revenue, profit margins, EPS and key performance metrics. Get detailed insights into the financial performance of Invinity Energy Systems plc, a leading company in the Renewable Utilities industry within the Utilities sector.
- Thai Nondestructive Testing Public Company Limited (TNDT.BK) Income Statement Analysis – Financial Results
- Shenzhen Infinova Limited (002528.SZ) Income Statement Analysis – Financial Results
- Vendetta Mining Corp. (VDTAF) Income Statement Analysis – Financial Results
- Knorr-Bremse Aktiengesellschaft (KBX.SW) Income Statement Analysis – Financial Results
- Manomay Tex India Limited (MANOMAY.NS) Income Statement Analysis – Financial Results
Invinity Energy Systems plc (IESVF)
About Invinity Energy Systems plc
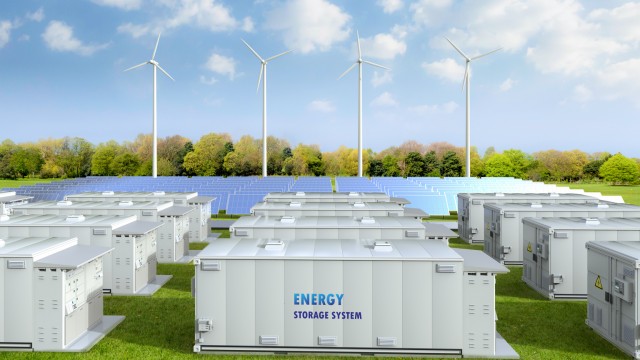
Invinity Energy Systems plc manufactures and sells vanadium flow batteries (VFB) for energy storage solutions in the United Kingdom, Canada, the United States, Australia, and China. The company also develops electricity grids, as well as offers electric grid services. It provides batteries for energy storage for utilities and developers, commercial and industrial, and off-grid and microgrid applications. Invinity Energy Systems plc was incorporated in 2006 and is based in Saint Helier, the United Kingdom.
| Metric | 2023 | 2022 | 2021 | 2020 | 2019 | 2018 | 2017 | 2016 | 2015 |
|---|---|---|---|---|---|---|---|---|---|
| Revenue | 22.01M | 2.94M | 3.19M | 406.00K | 663.00K | 2.52M | 2.23M | 8.88M | 8.06M |
| Cost of Revenue | 25.36M | 2.93M | 6.62M | 1.37M | 215.00K | 2.17M | 356.00K | 7.02M | 4.55M |
| Gross Profit | -3.36M | 17.00K | -3.44M | -967.00K | 448.00K | 354.00K | 1.87M | 1.86M | 3.51M |
| Gross Profit Ratio | -15.25% | 0.58% | -107.91% | -238.18% | 67.57% | 14.03% | 84.02% | 20.93% | 43.57% |
| Research & Development | 1.87M | 2.59M | 1.79M | 1.10M | 846.00K | 4.27M | 0.00 | 0.00 | 0.00 |
| General & Administrative | 4.31M | 5.73M | 3.42M | 2.59M | 7.39M | 12.64M | 2.79M | 1.88M | 0.00 |
| Selling & Marketing | 1.05M | 399.00K | 249.00K | 96.00K | 71.00K | 0.00 | 6.31M | 4.62M | 0.00 |
| SG&A | 5.36M | 6.13M | 3.67M | 2.68M | 7.39M | 12.64M | 9.10M | 6.50M | 4.28M |
| Other Expenses | 12.20M | -579.00K | 29.00K | -2.06M | -332.00K | 0.00 | 0.00 | 0.00 | 0.00 |
| Operating Expenses | 19.42M | 18.95M | 18.20M | 16.80M | 7.39M | 12.64M | 9.10M | 6.50M | 4.28M |
| Cost & Expenses | 44.78M | 21.88M | 24.82M | 18.17M | 7.61M | 14.81M | 9.46M | 13.52M | 8.82M |
| Interest Income | 299.00K | 62.00K | 0.00 | 1.00K | 1.00K | 1.00K | 14.81K | 1.62K | 18.87K |
| Interest Expense | 813.00K | 65.00K | 45.00K | 2.30M | 28.00K | 0.00 | 0.00 | 0.00 | 725.83 |
| Depreciation & Amortization | 1.40M | 1.35M | 727.00K | 577.00K | 380.00K | 297.00K | 116.00K | 46.73K | 24.68K |
| EBITDA | -20.97M | -17.12M | -20.60M | -15.26M | -6.97M | -12.17M | -2.86M | -1.84M | -738.16K |
| EBITDA Ratio | -95.28% | -579.89% | -658.52% | -3,150.25% | -976.17% | -482.13% | -319.39% | -51.75% | -9.16% |
| Operating Income | -22.78M | -18.98M | -21.26M | -20.23M | -7.45M | -12.28M | -7.23M | -4.64M | -762.84K |
| Operating Income Ratio | -103.51% | -644.77% | -667.63% | -4,982.76% | -1,122.93% | -486.61% | -324.60% | -52.28% | -9.46% |
| Total Other Income/Expenses | -401.00K | 445.00K | -108.00K | -4.04M | 65.00K | -161.00K | 4.42M | 2.69M | 1.27M |
| Income Before Tax | -23.18M | -18.54M | -21.37M | -24.27M | -7.38M | -12.44M | -7.48M | -4.75M | 511.71K |
| Income Before Tax Ratio | -105.33% | -629.65% | -671.02% | -5,978.08% | -1,113.12% | -492.99% | -335.86% | -53.48% | 6.35% |
| Income Tax Expense | 0.00 | 560.00K | -437.00K | 725.00K | 5.00K | 92.00K | 48.00K | -126.25K | -8.71K |
| Net Income | -23.18M | -18.54M | -21.37M | -24.27M | -6.84M | -12.68M | -7.40M | -4.52M | -981.32K |
| Net Income Ratio | -105.33% | -629.65% | -671.02% | -5,978.08% | -1,031.98% | -502.42% | -332.00% | -50.95% | -12.17% |
| EPS | -0.13 | -0.16 | -0.24 | -0.40 | -0.37 | -0.69 | -0.56 | -0.48 | -0.16 |
| EPS Diluted | -0.13 | -0.16 | -0.24 | -0.40 | -0.37 | -0.69 | -0.56 | -0.48 | -0.16 |
| Weighted Avg Shares Out | 176.44M | 117.67M | 89.93M | 59.98M | 18.43M | 18.43M | 13.12M | 9.47M | 5.95M |
| Weighted Avg Shares Out (Dil) | 176.44M | 117.67M | 89.93M | 59.98M | 18.43M | 18.43M | 13.12M | 9.47M | 6.20M |

Invinity Energy Sys Plc. (IESVF) Q2 2024 Earnings Call Transcript
Invinity Energy brings nets £56m from oversubscribed fundraiser

Vanadium Miners News For The Month Of March 2024
Vanadium Miners News For The Month Of February 2024

Invinity Energy jump 18% on Taiwan deal
Vanadium Miners News For The Month Of October 2023
Invinity chief says vanadium presents ‘a real alternative' to lithium batteries

Invinity Energy Systems plc to Present at the Planet MicroCap Showcase: VANCOUVER 2023 on Wednesday, September 6, 2023 & 1x1 Meetings on Thursday, September 7, 2023
Vanadium Miners News For The Month Of July 2023

Invinity Energy Systems plc (IESVF) Q4 2022 Earnings Call Transcript
Source: https://incomestatements.info
Category: Stock Reports
