See more : HEARTSEED INC (219A.T) Income Statement Analysis – Financial Results
Complete financial analysis of Imperalis Holding Corp. (IMHC) income statement, including revenue, profit margins, EPS and key performance metrics. Get detailed insights into the financial performance of Imperalis Holding Corp., a leading company in the Shell Companies industry within the Financial Services sector.
- Algonquin Power & Utilities Corp (AQN-PA.TO) Income Statement Analysis – Financial Results
- Forafric Global PLC (AFRIW) Income Statement Analysis – Financial Results
- Central Depository Services (India) Limited (CDSL.NS) Income Statement Analysis – Financial Results
- HY Energy Group Co.,Ltd (600387.SS) Income Statement Analysis – Financial Results
- BN HOLDINGS LIMITED (BNHOLDINGS.BO) Income Statement Analysis – Financial Results
Imperalis Holding Corp. (IMHC)
About Imperalis Holding Corp.
Imperalis Holding Corp. does not have significant operations. Previously, the company, through its subsidiary, CannaCure Sciences, Inc., engaged in the development, marketing, and sale of cannabidiol (CBD)-based personal care and cosmetic products. The company was formerly known as Coloured (US) Inc. and changed its name to Imperalis Holding Corp. in March 2011. The company was incorporated in 2005 and is headquartered in Las Vegas, Nevada. Imperalis Holding Corp. is a subsidiary of BitNile, Inc.
| Metric | 2023 | 2022 | 2021 | 2020 | 2019 | 2008 | 2007 | 2006 | 2005 |
|---|---|---|---|---|---|---|---|---|---|
| Revenue | 4.20M | 5.52M | 25.00 | 29.00 | 805.00 | 0.00 | 0.00 | 3.00M | 0.00 |
| Cost of Revenue | 3.31M | 3.50M | 15.00 | 0.00 | 804.20 | 0.00 | 0.00 | 0.00 | 0.00 |
| Gross Profit | 895.00K | 2.02M | 10.00 | 29.00 | 0.80 | 0.00 | 0.00 | 3.00M | 0.00 |
| Gross Profit Ratio | 21.30% | 36.54% | 40.00% | 100.00% | 0.10% | 0.00% | 0.00% | 100.00% | 0.00% |
| Research & Development | 418.00K | 697.00K | 504.00K | 0.00 | 0.00 | 0.00 | 0.00 | 0.00 | 0.00 |
| General & Administrative | 3.71M | 4.01M | 135.81K | 11.78K | 37.89K | 140.98K | 268.21K | 3.29M | 0.00 |
| Selling & Marketing | 1.45M | 1.52M | 910.00K | 0.00 | 9.64K | -3.36K | -10.50K | -9.61K | 0.00 |
| SG&A | 5.15M | 5.54M | 135.81K | 11.78K | 47.53K | 137.62K | 257.71K | 3.28M | 132.32K |
| Other Expenses | 399.00M | 510.00M | 42.66K | 42.58K | 0.00 | 3.36K | 10.50K | 9.61K | 4.93K |
| Operating Expenses | 5.57M | 6.23M | 178.47K | 54.36K | 47.53K | 140.98K | 268.21K | 3.29M | 137.25K |
| Cost & Expenses | 8.88M | 9.74M | 178.49K | 54.36K | 47.53K | 140.98K | 268.21K | 3.29M | 137.25K |
| Interest Income | 0.00 | 0.00 | 2.00 | 23.00 | 51.00 | 0.00 | 0.00 | 0.00 | 0.00 |
| Interest Expense | 160.00K | 5.00K | 10.03K | 1.97K | 41.78K | 4.66K | 1.25K | 4.51K | -137.97K |
| Depreciation & Amortization | 651.00K | 539.00K | 42.66K | 23.00 | 171.86K | 5.46K | 10.50K | 9.61K | 4.93K |
| EBITDA | -4.02M | -3.68M | -135.80K | -11.73K | -46.72K | -153.02K | -251.19K | -3.28M | -132.53K |
| EBITDA Ratio | -95.76% | -66.57% | -543,200.00% | -40,444.83% | -5,803.73% | 0.00% | 0.00% | -109.35% | 0.00% |
| Operating Income | -4.67M | -4.22M | -178.46K | -11.75K | -46.72K | -140.98K | -268.21K | -3.29M | -137.25K |
| Operating Income Ratio | -111.26% | -76.33% | -713,840.00% | -40,524.14% | -5,803.73% | 0.00% | 0.00% | -109.77% | 0.00% |
| Total Other Income/Expenses | -160.00K | -5.00K | 0.00 | -34.53K | -123.76K | -24.05K | -7.77K | -2.87K | -719.00 |
| Income Before Tax | -4.83M | -4.22M | -208.15K | -46.28K | -170.48K | -165.03K | -275.97K | -3.30M | -137.97K |
| Income Before Tax Ratio | -115.07% | -76.42% | -832,588.00% | -159,579.31% | -21,178.14% | 0.00% | 0.00% | -110.01% | 0.00% |
| Income Tax Expense | 1.00 | 5.00K | 52.11K | 44.53K | -46.73K | 165.03K | 275.97K | 3.30M | 137.97K |
| Net Income | -4.83M | -4.23M | -260.26K | -90.80K | -170.48K | -165.03K | -275.97K | -3.30M | -137.97K |
| Net Income Ratio | -115.07% | -76.51% | -1,041,040.00% | -313,117.24% | -21,178.14% | 0.00% | 0.00% | -110.01% | 0.00% |
| EPS | -0.03 | -0.08 | 0.00 | 0.00 | 0.00 | -0.46 | -0.90 | -13.13 | -1.66 |
| EPS Diluted | -0.03 | -0.08 | 0.00 | 0.00 | 0.00 | -0.46 | -0.90 | -13.13 | -1.66 |
| Weighted Avg Shares Out | 177.56M | 54.27M | 161.70M | 133.70M | 118.74M | 356.54K | 306.35K | 251.31K | 83.28K |
| Weighted Avg Shares Out (Dil) | 177.56M | 54.27M | 161.70M | 133.70M | 118.74M | 356.54K | 306.35K | 251.31K | 83.28K |

TurnOnGreen, Inc. Granted Approval of Public Listing Name and Ticker Symbol Change to TOGI

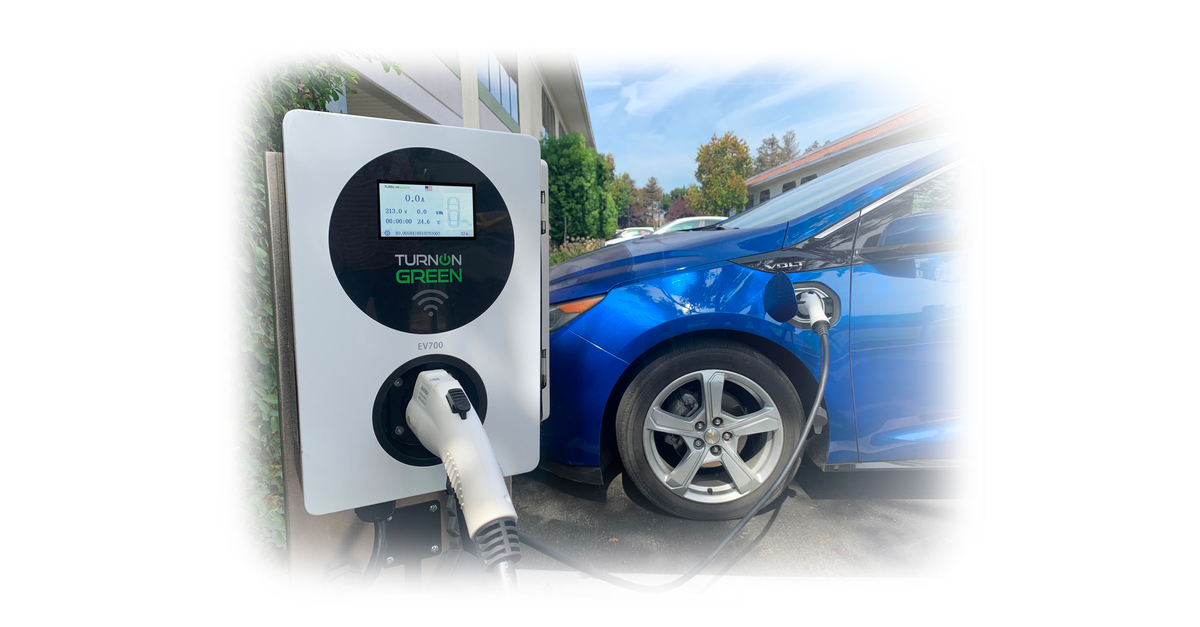
TurnOnGreen Expands Electric Vehicle Charging Infrastructure Across Select Tenet Health Facilities

TurnOnGreen Teams Up with Endliss Power to Exhibit at the InterSolar and Energy Storage North America Conference and Trade Show

TurnOnGreen, in collaboration with Key Solar LLC, will Install and Operate Its DC Fast Charging Stations in the New England Region

TurnOnGreen Teams Up with Nationwide Automotive Fleet Management Firms, Boosting Industry Sustainability

Imperalis Holding Corp., Completes Acquisition of TurnOnGreen and Appoints New Corporate Officers
Source: https://incomestatements.info
Category: Stock Reports
