See more : Maple Gold Mines Ltd. (MGMLF) Income Statement Analysis – Financial Results
Complete financial analysis of IQGeo Group plc (IQGLF) income statement, including revenue, profit margins, EPS and key performance metrics. Get detailed insights into the financial performance of IQGeo Group plc, a leading company in the Software – Application industry within the Technology sector.
- Redbubble Limited (RDBBY) Income Statement Analysis – Financial Results
- EYEFI Group Technologies Inc. (EGTI.CN) Income Statement Analysis – Financial Results
- Best Buy Co., Inc. (BBY) Income Statement Analysis – Financial Results
- MFA Financial, Inc. (MFA-PC) Income Statement Analysis – Financial Results
- Enphys Acquisition Corp. (NFYS-UN) Income Statement Analysis – Financial Results
IQGeo Group plc (IQGLF)
About IQGeo Group plc
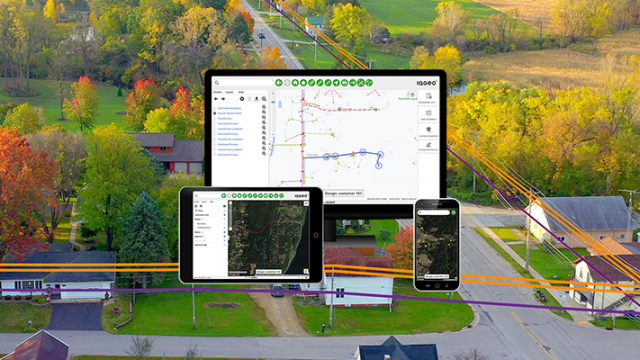
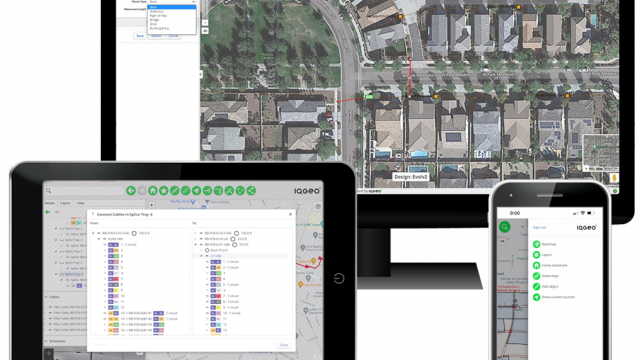
IQGeo Group plc develops geospatial software to the telecoms and utility network industries in the United Kingdom, Europe, the United States, Canada, Japan, and internationally. The company provides IQGeo Platform, which designs and manages complex and constantly evolving network assets; IQGeo Network Manager that plans, designs, and supports network lifecycle through construction and maintenance operations; IQGeo Workflow Manager software, which helps to control telecom and utility construction and maintenance activities; IQGeo Inspection and Survey software that provides a flexible mobile interface for field inspection teams; and IQGeo Network Revenue Optimizer software, which automatically produces multiple telecom construction route options for connecting commercial or residential premises. It also offers IQGeo development environment to implement applications that work in any modern web browser and on any mobile device, online or offline; IQGeo Fiber Planning software, which automatically generates a cost-optimized next-generation fiber network plan and design; IQGeo in the cloud, a cloud hosting of critical system infrastructure; IQGeo GIS integrations for data integration from virtually any application and geospatial data source; and IQGeo professional services. The company was formerly known as Ubisense Group Plc and changed its name to IQGeo Group plc in January 2019. IQGeo Group plc was founded in 2002 and is headquartered in Cambridge, the United Kingdom.
| Metric | 2023 | 2022 | 2021 | 2020 | 2019 | 2018 | 2017 | 2016 | 2015 | 2014 | 2013 | 2012 | 2011 | 2010 | 2009 | 2008 |
|---|---|---|---|---|---|---|---|---|---|---|---|---|---|---|---|---|
| Revenue | 44.49M | 26.59M | 13.85M | 9.16M | 7.81M | 9.98M | 27.26M | 26.52M | 21.98M | 35.05M | 27.00M | 24.29M | 23.79M | 17.70M | 14.99M | 9.69M |
| Cost of Revenue | 21.69M | 10.93M | 5.05M | 4.41M | 4.56M | 5.60M | 16.40M | 16.28M | 14.29M | 21.05M | 17.76M | 14.69M | 15.31M | 11.76M | 9.66M | 6.32M |
| Gross Profit | 22.80M | 15.67M | 8.80M | 4.75M | 3.24M | 4.38M | 10.86M | 10.24M | 7.69M | 14.00M | 9.24M | 9.60M | 8.48M | 5.94M | 5.33M | 3.37M |
| Gross Profit Ratio | 51.25% | 58.91% | 63.52% | 51.84% | 41.54% | 43.89% | 39.83% | 38.62% | 34.99% | 39.94% | 34.22% | 39.53% | 35.64% | 33.54% | 35.55% | 34.77% |
| Research & Development | 1.65M | 1.02M | 584.00K | 320.00K | 238.00K | 95.00K | 47.00K | 466.00K | 581.00K | 3.55M | 2.17M | 0.00 | 1.11M | 939.00K | 836.00K | 690.00K |
| General & Administrative | 0.00 | 0.00 | 0.00 | 0.00 | 0.00 | 0.00 | 0.00 | 0.00 | 0.00 | 0.00 | 0.00 | 8.45M | 7.03M | 0.00 | 0.00 | 0.00 |
| Selling & Marketing | 0.00 | 0.00 | 0.00 | 0.00 | 0.00 | 0.00 | 0.00 | 0.00 | 0.00 | 0.00 | 0.00 | 0.00 | 0.00 | 0.00 | 0.00 | 0.00 |
| SG&A | 18.71M | 12.67M | 9.28M | 7.07M | 7.99M | 5.69M | 4.89M | 9.22M | 12.16M | 10.82M | 9.10M | 8.45M | 7.03M | 0.00 | 0.00 | 0.00 |
| Other Expenses | 0.00 | 0.00 | 0.00 | 0.00 | 0.00 | 0.00 | 0.00 | 0.00 | -59.00K | 0.00 | 0.00 | 0.00 | 0.00 | 0.00 | 0.00 | 0.00 |
| Operating Expenses | 20.36M | 16.76M | 11.88M | 8.74M | 9.29M | 6.74M | 13.66M | 13.39M | 20.60M | 16.22M | 10.10M | 9.95M | 7.82M | 5.39M | 4.40M | 4.09M |
| Cost & Expenses | 42.05M | 27.69M | 16.93M | 13.15M | 13.86M | 12.34M | 30.06M | 29.67M | 34.89M | 37.27M | 27.86M | 24.64M | 23.13M | 17.15M | 14.06M | 10.41M |
| Interest Income | 15.00K | 0.00 | 7.00K | 7.00K | 72.00K | 1.00K | 8.00K | 44.00K | 12.00K | 14.00K | 10.00K | 38.00K | 37.00K | 5.00K | 16.00K | 12.00K |
| Interest Expense | 480.00K | 288.00K | 174.00K | 105.00K | 10.00K | 14.00K | 87.00K | 323.00K | 301.00K | 211.00K | 103.00K | 0.00 | 185.00K | 237.00K | 230.00K | 275.00K |
| Depreciation & Amortization | 3.91M | 2.69M | 1.97M | 1.37M | 1.10M | 1.05M | 853.00K | 3.47M | 7.68M | 5.32M | 1.91M | 1.44M | 764.00K | 396.00K | 383.00K | 385.00K |
| EBITDA | 6.34M | 1.16M | -1.07M | -2.95M | -4.99M | -1.40M | -195.00K | 2.59M | -9.29M | 748.00K | 295.00K | 709.00K | 1.09M | 1.03M | 1.33M | -323.00K |
| EBITDA Ratio | 14.25% | 8.16% | -8.27% | -29.07% | -63.90% | 8.99% | -0.72% | 12.12% | -23.87% | 8.88% | 3.92% | 4.66% | 6.14% | 5.81% | 8.87% | -3.33% |
| Operating Income | 2.44M | -1.53M | -2.57M | -4.33M | -6.30M | -1.59M | -3.06M | -6.17M | -16.98M | -4.58M | -1.63M | -766.00K | 289.00K | 627.00K | 930.00K | -720.00K |
| Operating Income Ratio | 5.48% | -5.74% | -18.59% | -47.27% | -80.66% | -15.94% | -11.21% | -23.24% | -77.24% | -13.07% | -6.02% | -3.15% | 1.22% | 3.54% | 6.21% | -7.43% |
| Total Other Income/Expenses | -465.00K | -288.00K | -167.00K | -98.00K | 62.00K | -13.00K | 3.00K | -279.00K | -289.00K | -197.00K | -93.00K | -390.00K | -148.00K | -232.00K | -214.00K | -263.00K |
| Income Before Tax | 57.00K | -1.81M | -2.74M | -4.43M | -6.23M | -1.60M | -3.13M | -6.44M | -17.27M | -4.78M | -1.72M | -728.00K | 141.00K | 395.00K | 716.00K | -983.00K |
| Income Before Tax Ratio | 0.13% | -6.82% | -19.79% | -48.35% | -79.86% | -16.07% | -11.50% | -24.30% | -78.56% | -13.63% | -6.37% | -3.00% | 0.59% | 2.23% | 4.78% | -10.14% |
| Income Tax Expense | 53.00K | -901.00K | -812.00K | -315.00K | -64.00K | 39.00K | -61.00K | -1.14M | -632.00K | -736.00K | 219.00K | -90.00K | 107.00K | -3.00K | -157.00K | -117.00K |
| Net Income | 4.00K | -913.00K | -1.93M | -4.11M | -5.77M | 19.84M | -3.06M | -5.20M | -16.57M | -4.09M | -1.97M | -638.00K | 34.00K | 398.00K | 873.00K | -866.00K |
| Net Income Ratio | 0.01% | -3.43% | -13.93% | -44.90% | -73.88% | 198.84% | -11.21% | -19.59% | -75.38% | -11.65% | -7.29% | -2.63% | 0.14% | 2.25% | 5.83% | -8.93% |
| EPS | 0.00 | -0.02 | -0.03 | -0.08 | -0.09 | 0.27 | -0.05 | -0.10 | -0.52 | -0.17 | -0.09 | -0.03 | 0.00 | 0.03 | 0.04 | -0.04 |
| EPS Diluted | 0.00 | -0.02 | -0.03 | -0.08 | -0.09 | 0.27 | -0.05 | -0.07 | -0.52 | -0.16 | -0.09 | -0.03 | 0.00 | 0.03 | 0.04 | -0.04 |
| Weighted Avg Shares Out | 61.69M | 58.82M | 57.31M | 50.20M | 65.98M | 73.09M | 58.48M | 49.76M | 31.66M | 24.54M | 21.98M | 21.76M | 18.90M | 12.03M | 21.42M | 21.42M |
| Weighted Avg Shares Out (Dil) | 65.92M | 58.82M | 57.31M | 50.20M | 65.98M | 73.35M | 58.69M | 69.97M | 32.08M | 25.51M | 23.02M | 23.15M | 19.29M | 12.59M | 21.42M | 21.42M |

IQGeo pens software deal with top ten US telecoms firm

IQGeo wins contract extension with tier one US customer

IQGeo wins $3m contract with US utility giant

IQGEO updates as capital markets day draws near
Source: https://incomestatements.info
Category: Stock Reports
