See more : Alto Metals Limited (AME.AX) Income Statement Analysis – Financial Results
Complete financial analysis of Investors Title Company (ITIC) income statement, including revenue, profit margins, EPS and key performance metrics. Get detailed insights into the financial performance of Investors Title Company, a leading company in the Insurance – Specialty industry within the Financial Services sector.
- Primeton Information Technologies, Inc. (688118.SS) Income Statement Analysis – Financial Results
- Sanoyas Holdings Corporation (7022.T) Income Statement Analysis – Financial Results
- Agroton Public Limited (AGT.WA) Income Statement Analysis – Financial Results
- Hiper Global Ltd. (HIPR.TA) Income Statement Analysis – Financial Results
- Energenesis Biomedical CO.,LTD. (6657.TW) Income Statement Analysis – Financial Results
Investors Title Company (ITIC)
About Investors Title Company
Investors Title Company, through its subsidiaries, engages in the issuance of residential and commercial title insurance for residential, institutional, commercial, and industrial properties. The company underwrites land title insurance for owners and mortgagees as a primary insurer; and assumes the reinsurance of title insurance risks from other title insurance companies. It also provides services in connection with tax-deferred exchanges of like-kind property; acts as a qualified intermediary in tax-deferred exchanges of property; coordinates the exchange aspects of the real estate transaction, such as drafting standard exchange documents, holding the exchange funds between the sale of the old property and the purchase of the new property, and accepting the formal identification of the replacement property. In addition, it serves as an exchange accommodation titleholder for accomplishing reverse exchanges when the taxpayers decide to acquire replacement property before selling the relinquished property. Further, the company offers investment management and trust services to individuals, companies, banks, and trusts; and consulting and management services to clients to start and operate a title insurance agency. It issues title insurance policies primarily through approved attorneys from underwriting offices, as well as through independent issuing agents in 24 states and the District of Columbia, primarily in the eastern half of the United States. The company was founded in 1972 and is headquartered in Chapel Hill, North Carolina.
| Metric | 2023 | 2022 | 2021 | 2020 | 2019 | 2018 | 2017 | 2016 | 2015 | 2014 | 2013 | 2012 | 2011 | 2010 | 2009 | 2008 | 2007 | 2006 | 2005 | 2004 | 2003 | 2002 | 2001 | 2000 | 1999 | 1998 | 1997 | 1996 | 1995 | 1994 | 1993 | 1992 | 1991 | 1990 | 1989 | 1988 | 1987 | 1986 | 1985 |
|---|---|---|---|---|---|---|---|---|---|---|---|---|---|---|---|---|---|---|---|---|---|---|---|---|---|---|---|---|---|---|---|---|---|---|---|---|---|---|---|
| Revenue | 224.75M | 283.39M | 329.50M | 236.41M | 183.50M | 156.26M | 161.65M | 138.49M | 127.20M | 123.12M | 126.25M | 115.08M | 90.69M | 71.31M | 71.31M | 71.12M | 84.94M | 84.66M | 87.86M | 79.84M | 90.83M | 73.25M | 64.47M | 42.23M | 47.37M | 48.48M | 32.39M | 22.99M | 17.37M | 16.90M | 2.60M | 14.30M | 10.30M | 9.80M | 8.90M | 9.10M | 10.00M | 8.90M | 6.20M |
| Cost of Revenue | 0.00 | 0.00 | 0.00 | 0.00 | 0.00 | 0.00 | 0.00 | 0.00 | 0.00 | 0.00 | 0.00 | 0.00 | 0.00 | 0.00 | 0.00 | 0.00 | 0.00 | 349.65K | 0.00 | 0.00 | 0.00 | 0.00 | 0.00 | 0.00 | 0.00 | 0.00 | 0.00 | 0.00 | 0.00 | 0.00 | 0.00 | 0.00 | 0.00 | 0.00 | 0.00 | 0.00 | 0.00 | 0.00 | 0.00 |
| Gross Profit | 224.75M | 283.39M | 329.50M | 236.41M | 183.50M | 156.26M | 161.65M | 138.49M | 127.20M | 123.12M | 126.25M | 115.08M | 90.69M | 71.31M | 71.31M | 71.12M | 84.94M | 84.31M | 87.86M | 79.84M | 90.83M | 73.25M | 64.47M | 42.23M | 47.37M | 48.48M | 32.39M | 22.99M | 17.37M | 16.90M | 2.60M | 14.30M | 10.30M | 9.80M | 8.90M | 9.10M | 10.00M | 8.90M | 6.20M |
| Gross Profit Ratio | 100.00% | 100.00% | 100.00% | 100.00% | 100.00% | 100.00% | 100.00% | 100.00% | 100.00% | 100.00% | 100.00% | 100.00% | 100.00% | 100.00% | 100.00% | 100.00% | 100.00% | 99.59% | 100.00% | 100.00% | 100.00% | 100.00% | 100.00% | 100.00% | 100.00% | 100.00% | 100.00% | 100.00% | 100.00% | 100.00% | 100.00% | 100.00% | 100.00% | 100.00% | 100.00% | 100.00% | 100.00% | 100.00% | 100.00% |
| Research & Development | 0.00 | 0.00 | 0.00 | 0.00 | 0.00 | 0.00 | 0.00 | 0.00 | 0.00 | 0.00 | 0.00 | 0.00 | 0.00 | 0.00 | 0.00 | 0.00 | 0.00 | 0.00 | 0.00 | 0.00 | 0.00 | 0.00 | 0.00 | 0.00 | 0.00 | 0.00 | 0.00 | 0.00 | 0.00 | 0.00 | 0.00 | 0.00 | 0.00 | 0.00 | 0.00 | 0.00 | 0.00 | 0.00 | 0.00 |
| General & Administrative | 76.71M | 102.65M | 77.25M | 61.88M | 55.31M | 52.37M | 54.17M | 43.17M | 39.72M | 36.10M | 34.82M | 31.03M | 27.74M | 56.18M | 25.73M | 28.27M | 28.42M | 26.71M | 30.31M | 29.15M | 39.11M | 32.01M | 28.07M | 15.47M | 17.05M | 17.40M | 10.07M | 5.78M | 3.67M | 7.90M | 0.00 | 2.60M | 6.00M | 1.50M | 1.10M | 0.00 | 0.00 | 0.00 | 0.00 |
| Selling & Marketing | 0.00 | 0.00 | 0.00 | 0.00 | 0.00 | 0.00 | 68.64M | 0.00 | 2.37M | 2.33M | 2.15M | 1.86M | 49.60M | 1.54M | 29.25M | 27.72M | 0.00 | 0.00 | 0.00 | 0.00 | 0.00 | 0.00 | 0.00 | 0.00 | 0.00 | 0.00 | 0.00 | 0.00 | 0.00 | 0.00 | 0.00 | 0.00 | 0.00 | 0.00 | 0.00 | 0.00 | 0.00 | 0.00 | 0.00 |
| SG&A | 76.71M | 102.65M | 77.25M | 61.88M | 55.31M | 52.37M | 54.17M | 43.17M | 39.72M | 36.10M | 34.82M | 31.03M | 77.34M | 57.73M | 54.98M | 55.98M | 28.42M | 26.71M | 30.31M | 29.15M | 39.11M | 32.01M | 28.07M | 15.47M | 17.05M | 17.40M | 10.07M | 5.78M | 3.67M | 7.90M | 0.00 | 2.60M | 6.00M | 1.50M | 1.10M | 0.00 | 0.00 | 0.00 | 0.00 |
| Other Expenses | 0.00 | -355.94M | -326.59M | -249.25M | -199.67M | -176.94M | -185.55M | -153.53M | -149.15M | -145.73M | -139.52M | -130.03M | -158.52M | -120.42M | -120.37M | -130.32M | -101.54M | 0.00 | -99.59M | -93.49M | -113.77M | -93.58M | -83.81M | -53.44M | -57.95M | -58.18M | -36.00M | -23.35M | -16.62M | -20.30M | -300.00K | -17.40M | -15.30M | -9.50M | -8.30M | -6.50M | -7.00M | -5.70M | -3.90M |
| Operating Expenses | 94.07M | -253.28M | -249.34M | -187.37M | -144.36M | -124.57M | -131.38M | -110.36M | -109.42M | -109.63M | -104.71M | -99.00M | -81.19M | -62.69M | -65.39M | -74.34M | -73.12M | 141.50K | -69.28M | -64.34M | -74.66M | -61.58M | -55.73M | -37.97M | -40.91M | -40.78M | -25.94M | -17.57M | -12.95M | -12.40M | -300.00K | -14.80M | -9.30M | -8.00M | -7.20M | -6.50M | -7.00M | -5.70M | -3.90M |
| Cost & Expenses | 94.07M | 253.28M | 244.57M | 186.75M | 143.68M | 129.19M | 131.38M | 110.36M | 109.42M | 109.63M | 104.71M | 99.00M | 81.19M | 62.69M | 65.39M | 74.34M | 73.12M | 67.33M | 69.28M | 64.34M | 74.66M | 61.58M | 55.73M | 37.97M | 40.91M | 40.78M | 25.94M | 17.57M | 12.96M | 8.00M | 100.00K | 2.70M | 6.40M | 1.50M | 1.10M | 300.00K | -7.00M | -5.70M | 100.00K |
| Interest Income | 9.06M | 4.70M | 3.77M | 4.39M | 4.75M | 4.62M | 4.44M | 4.68M | 4.53M | 4.26M | 3.89M | 3.98M | 3.60M | 3.67M | 3.78M | 0.00 | 0.00 | 561.40K | 0.00 | 0.00 | 0.00 | 0.00 | 0.00 | 0.00 | 0.00 | 0.00 | 0.00 | 0.00 | 0.00 | 0.00 | 0.00 | 0.00 | 0.00 | 0.00 | 0.00 | 0.00 | 0.00 | 0.00 | 0.00 |
| Interest Expense | 0.00 | 0.00 | 0.00 | 0.00 | 0.00 | 4.62M | 0.00 | 0.00 | 0.00 | 0.00 | 0.00 | 0.00 | 0.00 | 0.00 | 0.00 | 0.00 | 0.00 | 0.00 | 0.00 | 0.00 | 0.00 | 0.00 | 0.00 | 0.00 | 0.00 | 0.00 | 0.00 | 0.00 | 11.10K | 100.00K | 100.00K | 100.00K | 0.00 | 0.00 | 0.00 | 300.00K | 0.00 | 0.00 | 100.00K |
| Depreciation & Amortization | 4.12M | 3.58M | 2.44M | 2.26M | 2.26M | 2.23M | 2.35M | 1.52M | 1.83M | 1.46M | 1.18M | 954.93K | 814.65K | 851.85K | 971.82K | 1.23M | 1.48M | 1.34M | 1.09M | 1.01M | 874.96K | 986.89K | 1.41M | 794.69K | 470.84K | 393.03K | 346.55K | 328.68K | 307.65K | 300.00K | 0.00 | 200.00K | 100.00K | 200.00K | 100.00K | 0.00 | 0.00 | 0.00 | 0.00 |
| EBITDA | 30.35M | 33.69M | 87.37M | 51.92M | 39.82M | 27.07M | 32.62M | 29.65M | 9.20M | 14.95M | 22.72M | 17.03M | 10.31M | 9.47M | 6.87M | -1.98M | 13.28M | 0.00 | 19.67M | 0.00 | 0.00 | 0.00 | 0.00 | 0.00 | 0.00 | 0.00 | 0.00 | 0.00 | 4.72M | 400.00K | 0.00 | 300.00K | 0.00 | 0.00 | 0.00 | 0.00 | 3.00M | 3.20M | 0.00 |
| EBITDA Ratio | 13.50% | 11.89% | 25.07% | 21.70% | 22.57% | 21.71% | 20.18% | 21.41% | 15.42% | 12.14% | 18.00% | 14.80% | 11.37% | 13.28% | 9.66% | -2.79% | 15.66% | 22.06% | 22.39% | 20.69% | 18.77% | 17.28% | 15.75% | 11.97% | 14.64% | 16.69% | 20.99% | 25.01% | 27.19% | 28.40% | 88.46% | -2.10% | 10.68% | 20.41% | 20.22% | 28.57% | 30.00% | 35.96% | 37.10% |
| Operating Income | 26.23M | 30.11M | 80.16M | 49.04M | 39.15M | 31.69M | 30.27M | 28.13M | 17.78M | 13.49M | 21.54M | 16.08M | 9.50M | 8.62M | 5.92M | -3.22M | 11.82M | 244.29K | 18.58M | 15.50M | 16.17M | 11.67M | 8.74M | 4.26M | 6.46M | 7.70M | 6.45M | 5.42M | 4.41M | 4.50M | 2.30M | -500.00K | 1.00M | 1.80M | 1.70M | 2.60M | 3.00M | 3.20M | 2.30M |
| Operating Income Ratio | 11.67% | 10.62% | 24.33% | 20.74% | 21.33% | 20.28% | 18.73% | 20.31% | 13.98% | 10.96% | 17.06% | 13.97% | 10.47% | 12.08% | 8.30% | -4.52% | 13.92% | 0.29% | 21.15% | 19.42% | 17.80% | 15.93% | 13.55% | 10.09% | 13.64% | 15.87% | 19.92% | 23.58% | 25.42% | 26.63% | 88.46% | -3.50% | 9.71% | 18.37% | 19.10% | 28.57% | 30.00% | 35.96% | 37.10% |
| Total Other Income/Expenses | 0.00 | -150.57M | -163.36M | -124.84M | -88.32M | -76.84M | -83.22M | -72.42M | -70.43M | -74.35M | -70.57M | -98.96M | -814.65K | -851.85K | -758.66K | -1.25M | -1.46M | 0.00 | -1.09M | 0.00 | 16.17M | 11.67M | 8.74M | 0.00 | 6.46M | 7.70M | 6.45M | 5.42M | 4.40M | 1.30M | 0.00 | 1.00M | 0.00 | 0.00 | 0.00 | 0.00 | 0.00 | 0.00 | 0.00 |
| Income Before Tax | 26.23M | 30.11M | 84.93M | 49.66M | 39.82M | 27.07M | 30.27M | 28.13M | 17.78M | 13.49M | 21.54M | 16.08M | 9.50M | 8.62M | 5.92M | -3.22M | 11.82M | 17.33M | 18.58M | 15.50M | 16.17M | 11.67M | 8.74M | 4.26M | 6.46M | 7.70M | 6.45M | 5.42M | 4.40M | 5.80M | 0.00 | 500.00K | 1.90M | 2.90M | 2.60M | 0.00 | 0.00 | 0.00 | 0.00 |
| Income Before Tax Ratio | 11.67% | 10.62% | 25.78% | 21.01% | 21.70% | 17.32% | 18.73% | 20.31% | 13.98% | 10.96% | 17.06% | 13.97% | 10.47% | 12.08% | 8.30% | -4.52% | 13.92% | 20.47% | 21.15% | 19.42% | 17.80% | 15.93% | 13.55% | 10.09% | 13.64% | 15.87% | 19.92% | 23.58% | 25.36% | 34.32% | 0.00% | 3.50% | 18.45% | 29.59% | 29.21% | 0.00% | 0.00% | 0.00% | 0.00% |
| Income Tax Expense | 4.54M | 6.21M | 17.91M | 10.24M | 8.37M | 5.21M | 4.57M | 8.62M | 5.23M | 3.82M | 6.75M | 4.89M | 2.57M | 2.24M | 1.09M | -2.03M | 3.42M | 4.14M | 5.29M | 4.78M | 5.21M | 3.56M | 2.73M | 1.12M | 2.04M | 2.24M | 1.92M | 1.58M | 1.15M | 1.30M | -100.00K | 500.00K | 200.00K | 300.00K | 300.00K | 600.00K | 500.00K | 1.40M | 1.00M |
| Net Income | 21.69M | 23.90M | 67.02M | 39.42M | 31.46M | 21.86M | 25.70M | 19.52M | 12.55M | 9.67M | 14.80M | 11.19M | 6.93M | 6.37M | 4.83M | -1.18M | 8.40M | 13.19M | 13.29M | 10.72M | 10.97M | 8.11M | 6.01M | 3.14M | 4.42M | 5.46M | 4.53M | 3.84M | 3.25M | 3.10M | 2.30M | -1.10M | 800.00K | 1.50M | 1.40M | 1.70M | 2.50M | 1.80M | 1.20M |
| Net Income Ratio | 9.65% | 8.43% | 20.34% | 16.67% | 17.14% | 13.99% | 15.90% | 14.09% | 9.87% | 7.86% | 11.72% | 9.72% | 7.65% | 8.94% | 6.77% | -1.66% | 9.89% | 15.57% | 15.13% | 13.43% | 12.07% | 11.07% | 9.32% | 7.44% | 9.33% | 11.26% | 13.99% | 16.72% | 18.72% | 18.34% | 88.46% | -7.69% | 7.77% | 15.31% | 15.73% | 18.68% | 25.00% | 20.22% | 19.35% |
| EPS | 11.46 | 12.60 | 35.39 | 20.84 | 16.66 | 11.58 | 13.63 | 10.23 | 6.32 | 4.75 | 7.15 | 5.33 | 3.22 | 2.79 | 2.11 | -0.50 | 3.39 | 5.22 | 5.19 | 4.29 | 4.38 | 3.22 | 2.35 | 1.21 | 1.59 | 1.95 | 1.63 | 1.39 | 1.16 | 1.10 | 0.81 | -0.37 | 0.28 | 0.51 | 0.50 | 0.59 | 0.89 | 0.26 | 0.13 |
| EPS Diluted | 11.46 | 12.59 | 35.27 | 20.79 | 16.59 | 11.52 | 13.56 | 10.19 | 6.30 | 4.74 | 7.08 | 5.24 | 3.20 | 2.78 | 2.10 | -0.50 | 3.35 | 5.14 | 5.10 | 4.09 | 4.18 | 3.12 | 2.31 | 1.21 | 1.59 | 1.92 | 1.60 | 1.39 | 1.16 | 1.10 | 0.81 | -0.37 | 0.28 | 0.51 | 0.50 | 0.59 | 0.89 | 0.26 | 0.13 |
| Weighted Avg Shares Out | 1.89M | 1.90M | 1.89M | 1.89M | 1.89M | 1.89M | 1.89M | 1.91M | 1.98M | 2.03M | 2.06M | 2.08M | 2.15M | 2.28M | 2.29M | 2.36M | 2.48M | 2.53M | 2.56M | 2.50M | 2.50M | 2.52M | 2.55M | 2.59M | 2.78M | 2.81M | 2.78M | 2.77M | 2.80M | 2.82M | 2.84M | 2.97M | 2.86M | 2.94M | 2.80M | 2.88M | 2.81M | 8.79M | 8.93M |
| Weighted Avg Shares Out (Dil) | 1.89M | 1.90M | 1.90M | 1.90M | 1.90M | 1.90M | 1.90M | 1.92M | 1.99M | 2.04M | 2.08M | 2.12M | 2.17M | 2.29M | 2.30M | 2.36M | 2.51M | 2.56M | 2.61M | 2.62M | 2.62M | 2.60M | 2.60M | 2.60M | 2.79M | 2.84M | 2.83M | 2.80M | 2.84M | 2.82M | 2.84M | 2.97M | 2.86M | 2.94M | 2.80M | 2.88M | 2.81M | 8.79M | 8.93M |

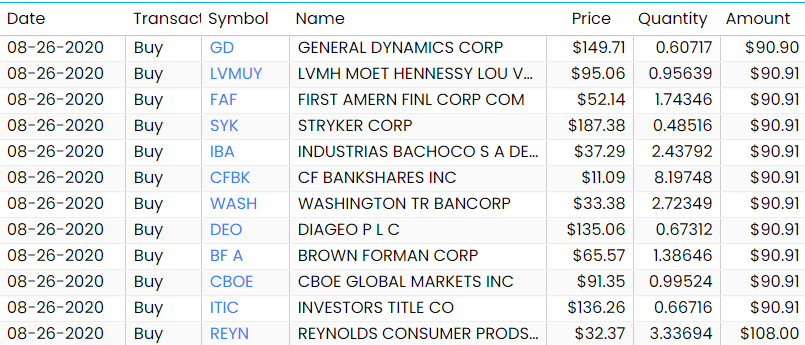
IMF August Buys: The 12 Stocks Added To My Fund

HouseCanary Issues Statement Regarding Opinion Issued by Fourth Court of Appeals

Investors Title Company Declares Quarterly Dividend

IMF July Buys: The 14 Stocks Added To My Portfolio

Investors Title Company Announces Record Second Quarter 2020 Financial Results

Investors Title Company Announces Record Second Quarter 2020 Financial Results

First American Financial Corp.: Taking Advantage Of Low Mortgage Rates (NYSE:FAF)

WTM London partners with ITIC to launch an Investment Summit

‘More needed’ on Vat front if tourism is to survive the crisis

July Stimulus: What businesses say they need to survive
Source: https://incomestatements.info
Category: Stock Reports
