See more : Chocoladefabriken Lindt & Sprüngli AG (LISP.SW) Income Statement Analysis – Financial Results
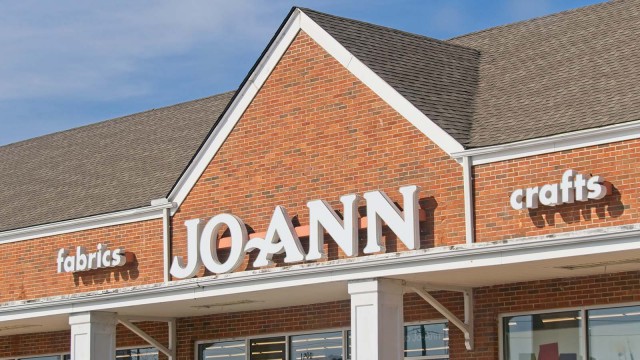
Complete financial analysis of JOANN Inc. (JOAN) income statement, including revenue, profit margins, EPS and key performance metrics. Get detailed insights into the financial performance of JOANN Inc., a leading company in the Specialty Retail industry within the Consumer Cyclical sector.
- PT Sejahtera Bintang Abadi Textile Tbk (SBAT.JK) Income Statement Analysis – Financial Results
- Steel & Tube Holdings Limited (STU.NZ) Income Statement Analysis – Financial Results
- Adaptimmune Therapeutics plc (ADAP) Income Statement Analysis – Financial Results
- Heeros Oyj (HEEROS.HE) Income Statement Analysis – Financial Results
- Sproutly Canada Inc. (SPR.CN) Income Statement Analysis – Financial Results
JOANN Inc. (JOAN)
About JOANN Inc.
JOANN Inc. operates as a specialty retailer of sewing and fabrics, and arts and crafts category products in the United States. Its products in sewing category include cotton fabrics; warm fabrics, such as fleece and flannel fabrics; home decorating and utility fabrics and accessories; fashion and sportswear fabrics; special occasion fabrics; seasonally themed and licensed fabric designs; and sewing construction supplies comprising cutting implements, threads, zippers, trims, tapes, pins, elastic, and buttons, as well as patterns for sewing projects. The company's products in arts and crafts, home décor, and other category consist of yarn and yarn accessories, and needlecraft kits and supplies; paper crafting components; craft materials; fine art materials; sewing machines, craft technology, lighting, irons, organizers, and other products; artificial floral products; seasonal décor and entertaining products; home décor accessories; ready-made frames; comprehensive assortment books and magazines; and non-merchandise services. JOANN Inc. offers its products through retail stores, as well as online. As of March 21, 2022, it operated 848 retail stores in 49 states. The company was formerly known as Jo-Ann Stores Holdings Inc. and changed its name to JOANN Inc. in February 2021. JOANN Inc. was founded in 1943 and is based in Hudson, Ohio.
| Metric | 2023 | 2022 | 2021 | 2020 | 2019 | 2018 |
|---|---|---|---|---|---|---|
| Revenue | 2.22B | 2.42B | 2.76B | 2.24B | 2.32B | 2.31B |
| Cost of Revenue | 1.18B | 1.20B | 1.40B | 1.14B | 1.15B | 1.13B |
| Gross Profit | 1.04B | 1.21B | 1.37B | 1.11B | 1.18B | 1.18B |
| Gross Profit Ratio | 46.93% | 50.16% | 49.46% | 49.32% | 50.61% | 51.16% |
| Research & Development | 16.10M | 15.50M | 13.10M | 13.00M | 0.00 | 0.00 |
| General & Administrative | 1.02B | 973.50M | 1.07B | 912.90M | 951.40M | 943.40M |
| Selling & Marketing | 55.80M | 59.40M | 60.60M | 64.50M | 0.00 | 0.00 |
| SG&A | 1.07B | 1.03B | 1.13B | 977.40M | 951.40M | 943.40M |
| Other Expenses | 80.40M | 80.10M | 80.00M | 77.50M | 76.00M | 78.80M |
| Operating Expenses | 1.15B | 1.11B | 1.21B | 1.05B | 1.03B | 1.02B |
| Cost & Expenses | 2.33B | 2.32B | 2.61B | 2.19B | 2.18B | 2.15B |
| Interest Income | 64.00M | 54.30M | 69.00M | 101.90M | 0.00 | 0.00 |
| Interest Expense | 64.00M | 51.20M | 69.00M | 101.90M | 101.10M | 95.40M |
| Depreciation & Amortization | 80.40M | 104.60M | 80.00M | 77.50M | 76.00M | 78.80M |
| EBITDA | -129.40M | 201.00M | 234.20M | 127.90M | 225.10M | 240.60M |
| EBITDA Ratio | -1.50% | 8.45% | 8.48% | 5.71% | 9.68% | 10.40% |
| Operating Income | -113.60M | 99.70M | 154.20M | 50.40M | 149.10M | 161.80M |
| Operating Income Ratio | -5.12% | 4.12% | 5.58% | 2.25% | 6.41% | 6.99% |
| Total Other Income/Expenses | -158.00M | -30.00M | 86.10M | -584.90M | -103.50M | -96.30M |
| Income Before Tax | -271.60M | 69.70M | 240.30M | -534.50M | 45.60M | 65.50M |
| Income Before Tax Ratio | -12.25% | 2.88% | 8.70% | -23.85% | 1.96% | 2.83% |
| Income Tax Expense | -73.20M | 13.00M | 28.00M | 12.10M | 10.30M | -31.00M |
| Net Income | -198.40M | 56.70M | 212.30M | -546.60M | 35.30M | 96.50M |
| Net Income Ratio | -8.95% | 2.35% | 7.69% | -24.39% | 1.52% | 4.17% |
| EPS | -4.87 | 1.40 | 5.24 | -1.35K | 0.87 | 2.39 |
| EPS Diluted | -4.87 | 1.40 | 5.24 | -1.35K | 0.87 | 2.39 |
| Weighted Avg Shares Out | 40.70M | 40.56M | 40.52M | 406.17K | 40.37M | 40.37M |
| Weighted Avg Shares Out (Dil) | 40.70M | 40.56M | 40.52M | 406.17K | 40.37M | 40.37M |

7 Retail Stocks Due for a Massive Short Squeeze

JOANN Inc. (JOAN) Q2 2024 Earnings Call Transcript

JOANN Inc. (JOAN) Reports Q2 Loss, Tops Revenue Estimates

Joann's stock rallies 20% as early Halloween, dorm décor offerings lift retailer's quarter

JOANN Announces Second Quarter Fiscal 2024 Results and Updates Full Year Outlook

JOANN to Hire More Than 5,000 Team Members to Help Customers Create a Handmade Holiday

Cantellus Group Appoints JoAnn Stonier and Bryce Goodman as Executive Advisors

JOANN Schedules Second Quarter Fiscal 2024 Earnings Release and Conference Call

Is Joann (JOAN) Stock the Next Big Short Squeeze?

Top 5 Consumer Stocks That May Explode In June - Advance Auto Parts (NYSE:AAP), EBET (NASDAQ:EBET)
Source: https://incomestatements.info
Category: Stock Reports
