See more : LexinFintech Holdings Ltd. (LX) Income Statement Analysis – Financial Results
Complete financial analysis of Joby Aviation, Inc. (JOBY) income statement, including revenue, profit margins, EPS and key performance metrics. Get detailed insights into the financial performance of Joby Aviation, Inc., a leading company in the Airlines, Airports & Air Services industry within the Industrials sector.
- ChemoMetec A/S (CHEMM.CO) Income Statement Analysis – Financial Results
- CMS Energy Corporation (0HR4.L) Income Statement Analysis – Financial Results
- Southeastern Banking Corporation (SEBC) Income Statement Analysis – Financial Results
- Bonava AB (publ) (BONAV-B.ST) Income Statement Analysis – Financial Results
- Payton Planar Magnetics Ltd. (PAY.BR) Income Statement Analysis – Financial Results
Joby Aviation, Inc. (JOBY)
About Joby Aviation, Inc.
Joby Aviation, Inc., a vertically integrated air mobility company, engages in building an electric vertical takeoff and landing aircraft optimized to deliver air transportation as a service. It intends to build an aerial ridesharing service. The company was founded in 2009 and is headquartered in Santa Cruz, California.
| Metric | 2023 | 2022 | 2021 | 2020 |
|---|---|---|---|---|
| Revenue | 1.03M | 0.00 | 0.00 | 0.00 |
| Cost of Revenue | 200.00K | 24.00M | 15.94M | 7.40M |
| Gross Profit | 832.00K | -24.00M | -15.94M | -7.40M |
| Gross Profit Ratio | 80.62% | 0.00% | 0.00% | 0.00% |
| Research & Development | 367.05M | 296.28M | 197.57M | 108.74M |
| General & Administrative | 105.68M | 95.92M | 61.52M | 23.49M |
| Selling & Marketing | 200.00K | 100.00 | 200.00 | 100.00 |
| SG&A | 105.88M | 95.92M | 61.52M | 23.50M |
| Other Expenses | 0.00 | 0.00 | 0.00 | 0.00 |
| Operating Expenses | 472.93M | 392.20M | 259.09M | 132.24M |
| Cost & Expenses | 473.13M | 392.20M | 259.09M | 132.24M |
| Interest Income | 45.56M | 16.91M | 1.15M | 5.65M |
| Interest Expense | 0.00 | 118.00K | 2.43M | 249.00K |
| Depreciation & Amortization | 30.49M | 24.00M | 15.94M | 7.40M |
| EBITDA | -441.60M | -233.84M | -172.49M | -106.48M |
| EBITDA Ratio | -42,790.79% | 0.00% | 0.00% | 0.00% |
| Operating Income | -472.09M | -392.20M | -259.09M | -132.24M |
| Operating Income Ratio | -45,745.54% | 0.00% | 0.00% | 0.00% |
| Total Other Income/Expenses | -40.82M | 134.25M | 68.23M | 18.10M |
| Income Before Tax | -512.91M | -257.95M | -190.86M | -114.13M |
| Income Before Tax Ratio | -49,700.68% | 0.00% | 0.00% | 0.00% |
| Income Tax Expense | 139.00K | 92.00K | -10.54M | 31.00K |
| Net Income | -513.05M | -258.04M | -180.32M | -114.16M |
| Net Income Ratio | -49,714.15% | 0.00% | 0.00% | 0.00% |
| EPS | -0.79 | -0.44 | -0.61 | -0.19 |
| EPS Diluted | -0.79 | -0.44 | -0.61 | -0.19 |
| Weighted Avg Shares Out | 647.91M | 585.54M | 294.85M | 603.89M |
| Weighted Avg Shares Out (Dil) | 647.91M | 585.54M | 294.85M | 603.89M |

Should You Buy Joby Aviation While It's Below $7.50?
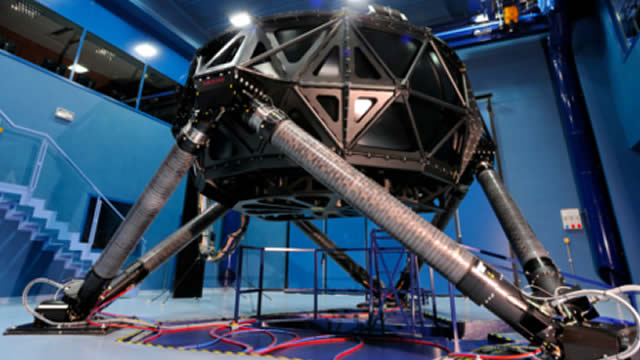
Joby and Archer Aviation shares soar after new Buy ratings but patience key for those stocking up
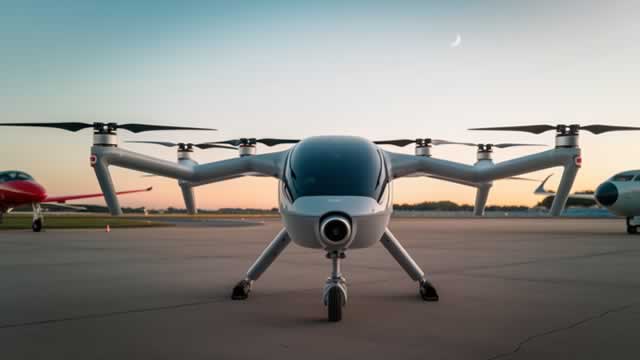
Why Joby Aviation Stock Soared Today
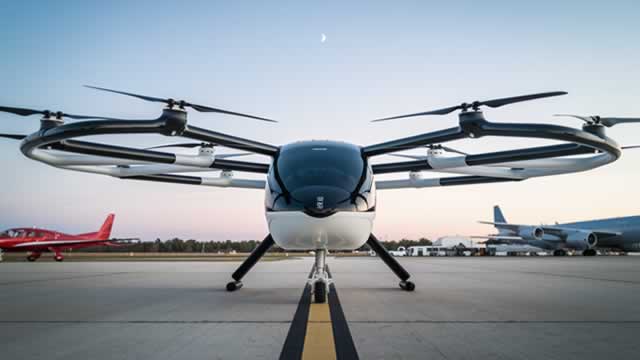
Joby Aviation Positioned For Air Taxi Leadership, Thanks To FAA Backing And Uber Partnership: Analyst

Fly the Joby Aircraft in the New Release of Microsoft Flight Simulator
Is Joby Aviation a Millionaire-Maker Stock?
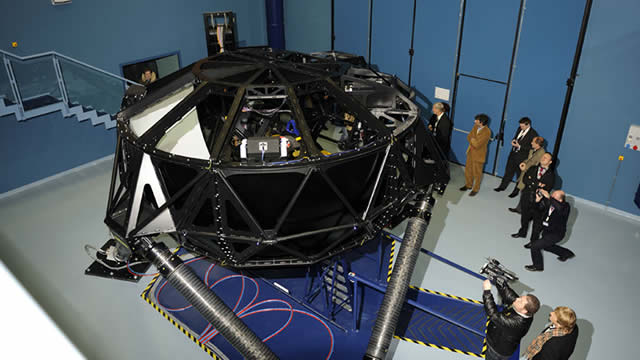
Cathie Wood Goes Bargain Hunting: 3 Stocks She Just Bought

Green Stock News for November 13th, 2024: $RIVN $BLNK $JOBY $RKLB
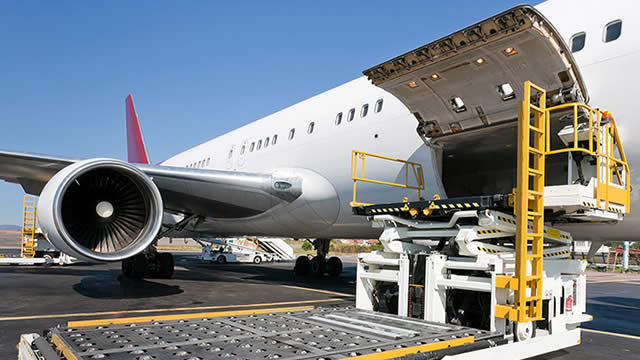
If You'd Invested $10,000 in Joby Aviation Stock at Its IPO, Here's How Much You'd Have Today
Archer Aviation Stock and Joby Aviation Stock: Are They Ready for Takeoff?
Source: https://incomestatements.info
Category: Stock Reports
