See more : Craftsman Automation Limited (CRAFTSMAN.BO) Income Statement Analysis – Financial Results
Complete financial analysis of Jubilee Metals Group PLC (JUBPF) income statement, including revenue, profit margins, EPS and key performance metrics. Get detailed insights into the financial performance of Jubilee Metals Group PLC, a leading company in the Industrial Materials industry within the Basic Materials sector.
- Allied Motion Technologies Inc. (AMOT) Income Statement Analysis – Financial Results
- ALSP Orchid Acquisition Corporation I (ALORU) Income Statement Analysis – Financial Results
- Nippon Koei Co., Ltd. (1954.T) Income Statement Analysis – Financial Results
- Guangdong Shirongzhaoye Co., Ltd. (002016.SZ) Income Statement Analysis – Financial Results
- Harbin Electric Corporation Jiamusi Electric Machine CO.,Ltd (000922.SZ) Income Statement Analysis – Financial Results
Jubilee Metals Group PLC (JUBPF)
About Jubilee Metals Group PLC
Jubilee Metals Group plc operates as a diversified metals recovery company. It operates through PGM and Chrome, Copper and Cobalt, and Other segments. The company explores for platinum group metals, such as platinum, palladium, rhodium, ruthenium, iridium, and osmium; and chrome, lead, zinc, vanadium, copper, and cobalt ores. It operates in South Africa, Australia, Mauritius, Zambia, and the United Kingdom. The company was formerly known as Jubilee Platinum Plc and changed its name to Jubilee Metals Group PLC in December 2017. Jubilee Metals Group PLC was incorporated in 2002 and is based in London, the United Kingdom.
| Metric | 2024 | 2023 | 2022 | 2021 | 2020 | 2019 | 2018 | 2017 | 2016 | 2015 | 2014 | 2013 | 2012 | 2011 | 2010 | 2009 | 2008 | 2007 | 2006 | 2005 | 2004 | 2003 |
|---|---|---|---|---|---|---|---|---|---|---|---|---|---|---|---|---|---|---|---|---|---|---|
| Revenue | 205.40M | 141.93M | 140.01M | 132.85M | 54.77M | 23.59M | 14.14M | 9.81M | 1.47M | 48.90K | 35.31K | 4.75M | 3.72M | 5.50M | 950.00K | 0.00 | 0.00 | 0.00 | 0.00 | 0.00 | 0.00 | 0.00 |
| Cost of Revenue | 169.43M | 110.54M | 94.67M | 61.73M | 29.69M | 10.71M | 8.67M | 8.04M | 608.31K | 25.53K | 83.85K | 2.90M | 3.53M | 5.24M | 458.00K | 0.00 | 0.00 | 0.00 | 0.00 | 0.00 | 0.00 | 0.00 |
| Gross Profit | 35.98M | 31.39M | 45.34M | 71.11M | 25.09M | 12.88M | 5.47M | 1.77M | 865.61K | 23.37K | -48.54K | 1.86M | 192.37K | 262.00K | 492.00K | 0.00 | 0.00 | 0.00 | 0.00 | 0.00 | 0.00 | 0.00 |
| Gross Profit Ratio | 17.52% | 22.12% | 32.38% | 53.53% | 45.80% | 54.59% | 38.67% | 18.02% | 58.73% | 47.79% | -137.48% | 39.05% | 5.16% | 4.76% | 51.79% | 0.00% | 0.00% | 0.00% | 0.00% | 0.00% | 0.00% | 0.00% |
| Research & Development | 0.00 | 0.00 | 0.00 | 0.00 | 0.00 | 0.00 | 0.00 | 702.03K | 0.00 | 0.00 | 720.92K | 915.59K | 0.00 | 0.00 | 0.00 | 0.00 | 0.00 | 0.00 | 0.00 | 0.00 | 0.00 | 0.00 |
| General & Administrative | 0.00 | 0.00 | 0.00 | 0.00 | 0.00 | 738.79K | 518.15K | 1.89M | 982.55K | 1.14M | 2.22M | 3.33M | 2.75M | 1.67M | 0.00 | 0.00 | 0.00 | 0.00 | 0.00 | 0.00 | 0.00 | 0.00 |
| Selling & Marketing | 0.00 | 0.00 | 0.00 | 0.00 | 0.00 | 0.00 | 0.00 | 0.00 | 0.00 | 0.00 | 0.00 | 0.00 | 230.00K | 202.00K | 0.00 | 0.00 | 0.00 | 0.00 | 0.00 | 0.00 | 0.00 | 0.00 |
| SG&A | 0.00 | 12.82M | 7.99M | 24.43M | 3.93M | 738.79K | 518.15K | 1.89M | 982.55K | 1.14M | 2.22M | 3.33M | 2.75M | 1.87M | 0.00 | 0.00 | 0.00 | 0.00 | 0.00 | 0.00 | 0.00 | 0.00 |
| Other Expenses | 24.19M | 15.87M | 0.00 | 0.00 | 1.47M | 385.00K | 9.23K | 348.00 | 0.00 | 0.00 | 0.00 | 0.00 | 0.00 | 0.00 | 0.00 | 0.00 | 0.00 | 0.00 | 0.00 | 0.00 | 0.00 | 0.00 |
| Operating Expenses | 24.19M | 15.87M | 19.69M | 25.73M | 9.20M | 8.00M | 5.05M | 3.68M | 3.62M | 2.62M | 3.39M | 8.72M | 8.41M | 6.77M | 4.51M | 2.39M | 4.54M | 1.75M | 710.00K | 559.00K | 239.00K | 542.00K |
| Cost & Expenses | 193.62M | 126.41M | 114.36M | 87.46M | 38.89M | 18.71M | 13.73M | 11.72M | 4.23M | 2.64M | 3.39M | 11.62M | 11.94M | 12.01M | 4.97M | 2.39M | 4.54M | 1.75M | 710.00K | 559.00K | 239.00K | 542.00K |
| Interest Income | 2.00M | 1.61M | 1.40M | 500.17K | 125.26K | 30.06K | 25.59K | 18.67K | 144.08K | 2.58K | 5.68K | 26.19K | 248.63K | 149.00K | 168.00K | 542.00K | 840.00K | 348.00K | 283.00K | 230.00K | 84.00K | 25.00K |
| Interest Expense | 8.78M | 5.16M | 1.45M | 1.67M | 2.42M | 1.11M | 1.38M | 198.57K | 13.42K | 194.76K | 259.19K | 268.56K | 582.62K | 648.00K | 0.00 | 0.00 | 1.00K | 145.00K | 51.00K | 0.00 | 0.00 | 0.00 |
| Depreciation & Amortization | 12.29M | 8.95M | 10.22M | 3.89M | 6.50M | 3.49M | 3.25M | 999.79K | 598.45K | 696.44K | 747.60K | 2.69M | 2.90M | 2.50M | 401.00K | 34.00K | 32.00K | 25.00K | 10.00K | 8.00K | 3.00K | 1.00K |
| EBITDA | 29.72M | 26.08M | 37.26M | 49.75M | 27.89M | 7.52M | 2.22M | -19.11M | -2.99M | -2.05M | -2.60M | -4.37M | -5.07M | -3.86M | -3.62M | 573.00K | -3.96M | -1.41M | -442.00K | -551.00K | -44.00K | -503.00K |
| EBITDA Ratio | 14.47% | 18.38% | 26.61% | 37.45% | 50.53% | 31.90% | 22.35% | -8.73% | -142.02% | -3,751.13% | -7,357.39% | -87.32% | -136.01% | -70.18% | -552.32% | 0.00% | 0.00% | 0.00% | 0.00% | 0.00% | 0.00% | 0.00% |
| Operating Income | 11.79M | 15.52M | 25.64M | 45.38M | 15.89M | 4.87M | 59.59K | -1.67M | -3.81M | -2.81M | -3.35M | -7.08M | -8.22M | -6.51M | -2.40M | -5.32M | -4.72M | -1.97M | -945.00K | -559.00K | -431.00K | -580.00K |
| Operating Income Ratio | 5.74% | 10.93% | 18.32% | 34.16% | 29.01% | 20.66% | 0.42% | -17.05% | -258.80% | -5,749.92% | -9,490.89% | -149.09% | -220.64% | -118.30% | -252.21% | 0.00% | 0.00% | 0.00% | 0.00% | 0.00% | 0.00% | 0.00% |
| Total Other Income/Expenses | -3.14M | -6.40M | 6.51M | -3.27M | -5.82M | 3.07M | -2.46M | -18.75M | 215.34K | -129.48K | -253.51K | -611.24K | -333.98K | -499.00K | 168.00K | 542.00K | 642.00K | 170.00K | 207.00K | 225.00K | -108.00K | 25.00K |
| Income Before Tax | 8.64M | 12.28M | 26.51M | 43.02M | 13.73M | 7.95M | -2.40M | -20.42M | -3.60M | -2.94M | -3.60M | -7.33M | -8.55M | -7.01M | -2.23M | -4.78M | -4.08M | -1.80M | -738.00K | -334.00K | -539.00K | -555.00K |
| Income Before Tax Ratio | 4.21% | 8.65% | 18.93% | 32.39% | 25.07% | 33.69% | -17.00% | -208.27% | -244.19% | -6,014.70% | -10,208.91% | -154.19% | -229.61% | -127.37% | -234.53% | 0.00% | 0.00% | 0.00% | 0.00% | 0.00% | 0.00% | 0.00% |
| Income Tax Expense | 2.25M | -688.11K | 8.13M | 2.79M | -4.50M | 969.97K | -434.18K | -9.85M | -201.90K | 875.20K | -12.66K | 146.63K | -672.51K | 580.00K | -3.25M | 5.28M | -21.00K | 434.00K | 371.00K | -34.00K | 382.00K | 76.00K |
| Net Income | 4.71M | 12.91M | 18.04M | 39.60M | 18.32M | 6.99M | -2.11M | -10.57M | -3.70M | -3.54M | -5.37M | -7.18M | -6.78M | -6.82M | -2.23M | -4.20M | -3.33M | -1.70M | -616.00K | -300.00K | -537.00K | -555.00K |
| Net Income Ratio | 2.29% | 9.10% | 12.88% | 29.81% | 33.45% | 29.65% | -14.96% | -107.80% | -250.75% | -7,229.94% | -15,197.26% | -151.19% | -182.10% | -123.95% | -234.53% | 0.00% | 0.00% | 0.00% | 0.00% | 0.00% | 0.00% | 0.00% |
| EPS | 0.00 | 0.00 | 0.01 | 0.02 | 0.01 | 0.00 | 0.00 | -0.01 | 0.00 | -0.01 | -0.01 | -0.02 | -0.02 | -0.03 | -0.01 | -0.04 | -0.03 | -0.02 | -0.01 | 0.00 | -0.01 | -0.01 |
| EPS Diluted | 0.00 | 0.00 | 0.01 | 0.02 | 0.01 | 0.00 | 0.00 | -0.01 | 0.00 | -0.01 | -0.01 | -0.02 | -0.02 | -0.03 | -0.01 | -0.04 | -0.03 | -0.02 | -0.01 | 0.00 | -0.01 | -0.01 |
| Weighted Avg Shares Out | 2.98B | 2.69B | 2.46B | 2.19B | 1.96B | 1.47B | 1.20B | 984.78M | 906.24M | 644.85M | 509.15M | 322.06M | 279.15M | 255.84M | 162.95M | 113.28M | 96.52M | 82.31M | 76.41M | 64.69M | 48.13M | 38.75M |
| Weighted Avg Shares Out (Dil) | 2.93B | 2.73B | 2.58B | 2.23B | 1.98B | 1.48B | 1.20B | 984.78M | 906.24M | 644.85M | 509.15M | 322.22M | 279.15M | 255.84M | 164.92M | 113.92M | 98.93M | 82.31M | 76.41M | 66.46M | 48.13M | 38.75M |
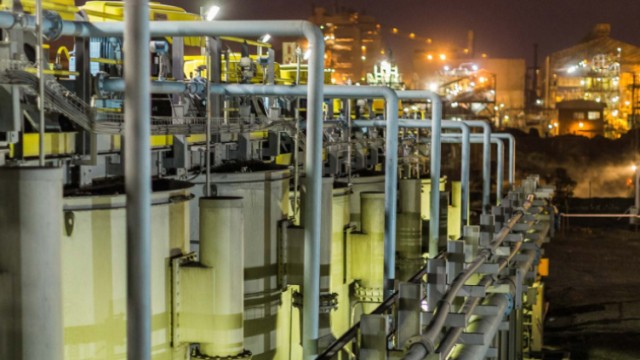
Jubilee Metals hails cash performance as profits hit by PGM price drop

Jubilee Metals rises 3% after upbeat update
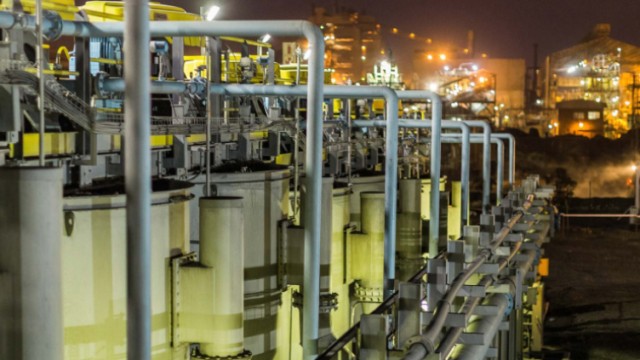
Jubilee Metals on an exciting growth path, says CEO alongside update
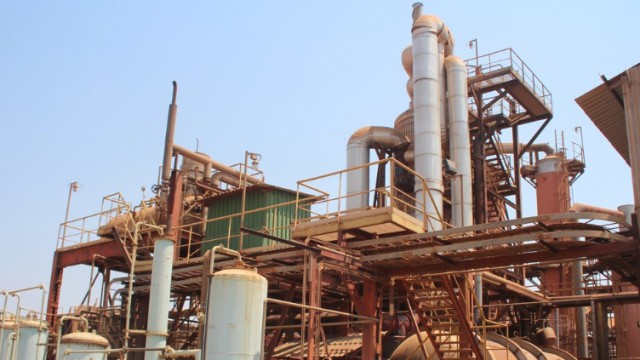
Jubilee Metals names new CFO and expands senior executive team
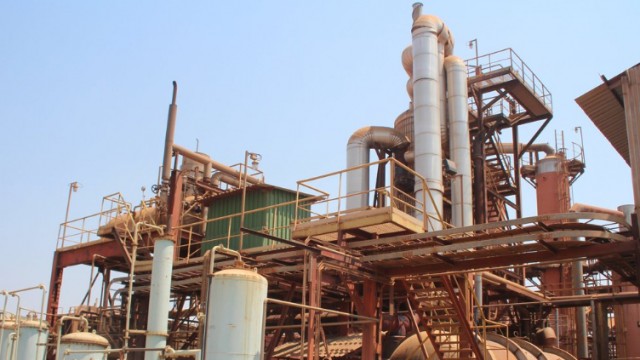
Jubilee Metals forecasts production to rise again after record year
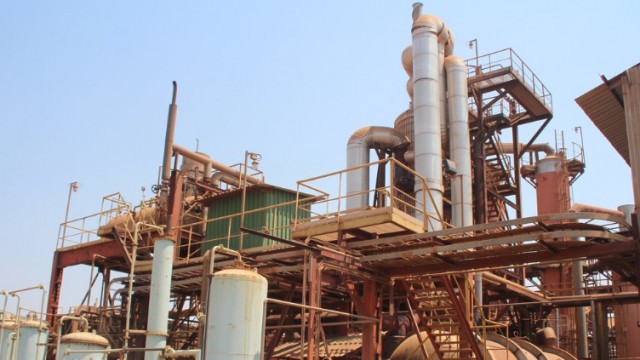
Jubilee Metals signs new chrome tailings deal in South Africa
Source: https://incomestatements.info
Category: Stock Reports
