See more : New World Resources Limited (NWC.AX) Income Statement Analysis – Financial Results
Complete financial analysis of The Kraft Heinz Company (KHC) income statement, including revenue, profit margins, EPS and key performance metrics. Get detailed insights into the financial performance of The Kraft Heinz Company, a leading company in the Packaged Foods industry within the Consumer Defensive sector.
- Cadeler A/S (CDLR) Income Statement Analysis – Financial Results
- Banswara Syntex Limited (BANSWRAS.NS) Income Statement Analysis – Financial Results
- AARNAV FASHIONS LIMITED (AARNAV.BO) Income Statement Analysis – Financial Results
- Madison Ave Media, Inc. (KHZM) Income Statement Analysis – Financial Results
- Westhaven Gold Corp. (WHN.V) Income Statement Analysis – Financial Results
The Kraft Heinz Company (KHC)
About The Kraft Heinz Company
The Kraft Heinz Company, together with its subsidiaries, manufactures and markets food and beverage products in the United States, Canada, the United Kingdom, and internationally. Its products include condiments and sauces, cheese and dairy products, meals, meats, refreshment beverages, coffee, and other grocery products. The company also offers dressings, healthy snacks, and other categories; and spices and other seasonings. It sells its products through its own sales organizations, as well as through independent brokers, agents, and distributors to chain, wholesale, cooperative and independent grocery accounts, convenience stores, drug stores, value stores, bakeries, pharmacies, mass merchants, club stores, and foodservice distributors and institutions, including hotels, restaurants, hospitals, health care facilities, and government agencies; and online through various e-commerce platforms and retailers. The company was formerly known as H.J. Heinz Holding Corporation and changed its name to The Kraft Heinz Company in July 2015. The Kraft Heinz Company was founded in 1869 and is headquartered in Pittsburgh, Pennsylvania.
| Metric | 2023 | 2022 | 2021 | 2020 | 2019 | 2018 | 2017 | 2016 | 2015 | 2014 | 2013 | 2012 | 2011 | 2010 |
|---|---|---|---|---|---|---|---|---|---|---|---|---|---|---|
| Revenue | 26.64B | 26.49B | 26.04B | 26.19B | 24.98B | 26.26B | 26.09B | 26.49B | 18.34B | 18.21B | 18.22B | 18.34B | 18.66B | 17.80B |
| Cost of Revenue | 17.71B | 18.36B | 17.36B | 17.01B | 16.83B | 17.31B | 16.95B | 16.90B | 12.58B | 13.36B | 11.40B | 12.50B | 12.76B | 11.78B |
| Gross Profit | 8.93B | 8.12B | 8.68B | 9.18B | 8.15B | 8.95B | 9.14B | 9.59B | 5.76B | 4.85B | 6.82B | 5.84B | 5.89B | 6.02B |
| Gross Profit Ratio | 33.51% | 30.67% | 33.34% | 35.05% | 32.62% | 34.08% | 35.03% | 36.19% | 31.42% | 26.61% | 37.45% | 31.84% | 31.59% | 33.83% |
| Research & Development | 147.00M | 127.00M | 140.00M | 119.00M | 112.00M | 109.00M | 93.00M | 120.00M | 105.00M | 58.00M | 94.50M | 0.00 | 0.00 | 0.00 |
| General & Administrative | 3.75B | -135.00M | -214.00M | 3.65B | 3.18B | 3.20B | 3.00B | 3.44B | 3.12B | 2.96B | 2.12B | 3.03B | 2.69B | 3.06B |
| Selling & Marketing | 0.00 | 3.58B | 3.59B | 3.65B | 3.18B | 3.20B | 3.00B | 3.44B | 3.12B | 2.96B | 2.12B | 3.03B | 281.00M | 3.06B |
| SG&A | 3.75B | 3.58B | 3.59B | 3.65B | 3.18B | 3.20B | 3.00B | 3.44B | 3.12B | 2.96B | 2.12B | 3.03B | 2.97B | 3.06B |
| Other Expenses | 0.00 | 253.00M | 295.00M | 296.00M | 952.00M | 183.00M | 627.00M | 15.00M | -305.00M | 0.00 | -22.00M | 21.00M | -2.00M | 40.00M |
| Operating Expenses | 4.48B | 3.58B | 3.59B | 3.65B | 3.18B | 3.20B | 3.00B | 3.44B | 3.12B | 2.96B | 2.12B | 3.03B | 2.97B | 3.06B |
| Cost & Expenses | 22.14B | 21.94B | 20.95B | 20.66B | 20.01B | 20.51B | 19.95B | 20.35B | 15.70B | 16.32B | 13.52B | 15.53B | 15.73B | 14.84B |
| Interest Income | 40.00M | 27.00M | 15.00M | 27.00M | 36.00M | 39.00M | 0.00 | 0.00 | 0.00 | 0.00 | 0.00 | 0.00 | 0.00 | 0.00 |
| Interest Expense | 912.00M | 921.00M | 2.05B | 1.39B | 1.36B | 1.29B | 1.23B | 1.13B | 1.32B | 484.00M | 501.00M | 258.00M | 4.00M | 3.00M |
| Depreciation & Amortization | 961.00M | 933.00M | 910.00M | 969.00M | 994.00M | 983.00M | 1.03B | 1.34B | 740.00M | 384.00M | 108.00M | 41.00M | 364.00M | 386.00M |
| EBITDA | 5.51B | 4.83B | 4.68B | 3.40B | 5.04B | -9.06B | 7.79B | 7.49B | 2.84B | 2.27B | 4.70B | 3.12B | 3.34B | 3.35B |
| EBITDA Ratio | 20.70% | 21.65% | 24.19% | 25.94% | 23.71% | 22.58% | 25.93% | 23.25% | 12.73% | 12.49% | 25.79% | 14.78% | 17.62% | 18.83% |
| Operating Income | 4.57B | 3.63B | 5.39B | 5.82B | 4.93B | 4.95B | 6.14B | 4.82B | 1.59B | 1.89B | 4.59B | 2.67B | 2.92B | 2.97B |
| Operating Income Ratio | 17.16% | 13.72% | 20.69% | 22.24% | 19.73% | 18.84% | 23.53% | 18.20% | 8.69% | 10.38% | 25.20% | 14.56% | 15.67% | 16.66% |
| Total Other Income/Expenses | -939.00M | -1.58B | -1.75B | -1.10B | -409.00M | -16.27B | -1.32B | -578.00M | -581.00M | -484.00M | -764.00M | -217.00M | 100.00M | 37.00M |
| Income Before Tax | 3.63B | 2.97B | 1.71B | 1.03B | 2.66B | -11.30B | 5.53B | 5.02B | 1.01B | 1.41B | 4.09B | 2.45B | 2.97B | 3.00B |
| Income Before Tax Ratio | 13.64% | 11.20% | 6.56% | 3.93% | 10.65% | -43.03% | 21.20% | 18.96% | 5.52% | 7.72% | 22.45% | 13.38% | 15.92% | 16.87% |
| Income Tax Expense | 787.00M | 598.00M | 684.00M | 669.00M | 728.00M | -1.01B | -5.46B | 1.38B | 366.00M | 363.00M | 1.38B | 811.00M | 1.13B | 1.11B |
| Net Income | 2.86B | 2.36B | 1.01B | 356.00M | 1.94B | -10.29B | 11.00B | 3.63B | 634.00M | 1.04B | 2.72B | 1.64B | 1.84B | 1.89B |
| Net Income Ratio | 10.72% | 8.92% | 3.89% | 1.36% | 7.75% | -39.19% | 42.17% | 13.71% | 3.46% | 5.73% | 14.90% | 8.95% | 9.86% | 10.62% |
| EPS | 2.33 | 1.93 | 0.83 | 0.29 | 1.58 | -8.44 | 9.03 | 2.84 | -0.34 | 1.75 | 4.55 | 2.77 | 3.00 | 3.20 |
| EPS Diluted | 2.31 | 1.91 | 0.82 | 0.29 | 1.58 | -8.44 | 8.95 | 2.81 | -0.34 | 1.74 | 4.51 | 2.75 | 3.00 | 3.20 |
| Weighted Avg Shares Out | 1.23B | 1.23B | 1.22B | 1.22B | 1.22B | 1.22B | 1.22B | 1.22B | 782.35M | 593.00M | 594.00M | 593.00M | 591.00M | 591.00M |
| Weighted Avg Shares Out (Dil) | 1.24B | 1.24B | 1.24B | 1.23B | 1.22B | 1.22B | 1.23B | 1.23B | 786.00M | 598.00M | 599.00M | 598.00M | 591.00M | 591.00M |

Kraft Heinz (KHC) Q3 Earnings: How Key Metrics Compare to Wall Street Estimates (revised)
Kraft Heinz faces delayed recovery but analysts urge patience in long-term strategy

5 High-Yield Warren Buffett Dividend Stocks Are Top Wall Street November Picks
Why Kraft Heinz Stock Tumbled by 3% on Wednesday

Kraft Heinz sales drop as inflation-battered consumers pull back on pricey packaged foods

Two Warren Buffett Stocks Get Pounded, With Apple Earnings Due

Kraft Heinz Q3 Earnings Top, Organic Sales Hurt by Soft Volumes
The Kraft Heinz Company (KHC) Q3 2024 Earnings Call Transcript
Kraft Heinz (KHC) Q3 Earnings: How Key Metrics Compare to Wall Street Estimates
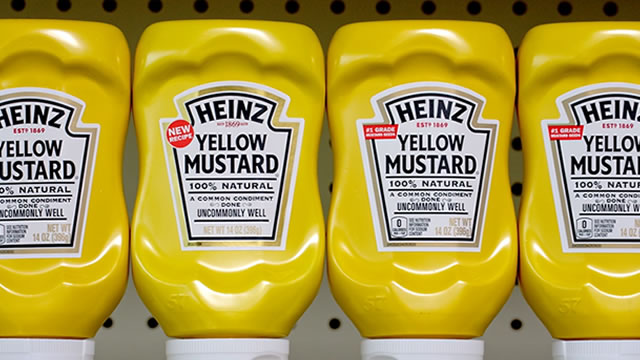
Kraft Heinz's stock drops as sales volumes fall again, more than prices rise
Source: https://incomestatements.info
Category: Stock Reports
