See more : Sanford Limited (SAN.NZ) Income Statement Analysis – Financial Results
Complete financial analysis of Kandi Technologies Group, Inc. (KNDI) income statement, including revenue, profit margins, EPS and key performance metrics. Get detailed insights into the financial performance of Kandi Technologies Group, Inc., a leading company in the Auto – Parts industry within the Consumer Cyclical sector.
- Implanet S.A. (IMPZY) Income Statement Analysis – Financial Results
- Petro River Oil Corp. (PTRC) Income Statement Analysis – Financial Results
- WiMi Hologram Cloud Inc. (WIMI) Income Statement Analysis – Financial Results
- EJF Investments Limited (EJFI.L) Income Statement Analysis – Financial Results
- PXP Energy Corporation (PXPEF) Income Statement Analysis – Financial Results
Kandi Technologies Group, Inc. (KNDI)
About Kandi Technologies Group, Inc.
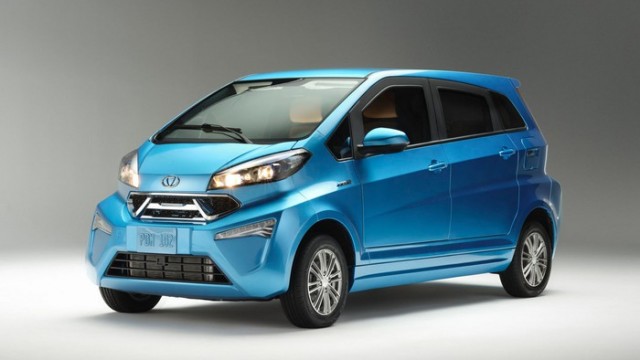
Kandi Technologies Group, Inc. designs, develops, manufactures, and commercializes electric vehicle (EV) products and parts, and off-road vehicles in the People's Republic of China and internationally. It offers off-road vehicles, including all-terrain vehicles, utility vehicles, go-karts, electric scooters, and electric self-balancing scooters, as well as related parts; and EV parts comprising battery packs, body parts, EV controllers, air conditioning units, and other auto parts. The company was formerly known as Kandi Technologies, Corp. and changed its name to Kandi Technologies Group, Inc. in December 2012. Kandi Technologies Group, Inc. was founded in 2002 and is headquartered in Jinhua, the People's Republic of China.
| Metric | 2023 | 2022 | 2021 | 2020 | 2019 | 2018 | 2017 | 2016 | 2015 | 2014 | 2013 | 2012 | 2011 | 2010 | 2009 | 2008 | 2007 | 2006 | 2005 | 2004 |
|---|---|---|---|---|---|---|---|---|---|---|---|---|---|---|---|---|---|---|---|---|
| Revenue | 123.60M | 117.81M | 91.49M | 76.92M | 135.74M | 112.44M | 102.81M | 129.49M | 201.07M | 170.23M | 94.54M | 64.51M | 40.18M | 42.88M | 33.83M | 40.51M | 34.70M | 0.00 | 0.00 | 0.00 |
| Cost of Revenue | 82.23M | 98.30M | 75.24M | 63.43M | 110.31M | 92.19M | 88.46M | 111.77M | 172.65M | 146.83M | 72.79M | 51.62M | 30.96M | 33.26M | 25.61M | 30.92M | 27.24M | 0.00 | 0.00 | 0.00 |
| Gross Profit | 41.37M | 19.52M | 16.25M | 13.49M | 25.43M | 20.25M | 14.34M | 17.72M | 28.42M | 23.40M | 21.74M | 12.89M | 9.21M | 9.62M | 8.21M | 9.59M | 7.47M | 0.00 | 0.00 | 0.00 |
| Gross Profit Ratio | 33.47% | 16.57% | 17.76% | 17.53% | 18.73% | 18.01% | 13.95% | 13.69% | 14.13% | 13.75% | 23.00% | 19.99% | 22.93% | 22.44% | 24.28% | 23.68% | 21.52% | 0.00% | 0.00% | 0.00% |
| Research & Development | 4.27M | 6.03M | 38.97M | 7.25M | 6.21M | 10.08M | 27.63M | 26.50M | 3.48M | 2.76M | 3.73M | 2.88M | 2.30M | 1.91M | 2.34M | 839.99K | 0.00 | 0.00 | 0.00 | 0.00 |
| General & Administrative | 35.38M | 32.33M | 19.61M | 13.04M | 14.24M | 8.61M | 11.33M | 20.67M | 28.26M | 14.06M | 16.06M | 4.25M | 3.46M | 3.37M | 2.57M | 1.84M | 1.99K | 1.99K | 0.00 | 0.00 |
| Selling & Marketing | 13.34M | 5.50M | 4.74M | 6.62M | 4.07M | 3.19M | 1.47M | 1.57M | 633.86K | 1.35M | 399.50K | 455.98K | 414.26K | 1.12M | 1.02M | 477.41K | 2.28M | 4.15K | 0.00 | 0.00 |
| SG&A | 48.72M | 37.83M | 24.34M | 19.66M | 18.31M | 11.80M | 12.80M | 22.23M | 28.89M | 15.40M | 16.46M | 4.71M | 3.87M | 4.49M | 3.60M | 2.31M | 2.28M | 6.14K | 4.31K | 23.50K |
| Other Expenses | 1.44M | -1.64M | -1.23M | -1.13M | -792.63K | 956.84K | 123.93K | 1.63M | 1.81M | -34.65K | 676.26K | 332.94K | 0.00 | 0.00 | 0.00 | 0.00 | 0.00 | 0.00 | 46.00K | 0.00 |
| Operating Expenses | 54.42M | 42.22M | 62.08M | 25.78M | 23.73M | 4.10M | 34.51M | 22.82M | 30.73M | 17.87M | 19.96M | 7.45M | 6.18M | 6.40M | 5.94M | 3.15M | 2.28M | 6.14K | 50.31K | 23.50K |
| Cost & Expenses | 136.65M | 140.51M | 137.32M | 89.21M | 134.04M | 96.29M | 122.97M | 134.59M | 203.38M | 164.70M | 92.75M | 59.07M | 37.14M | 39.66M | 31.55M | 34.07M | 29.51M | 6.14K | 50.31K | 23.50K |
| Interest Income | 9.98M | 6.43M | 4.21M | 2.19M | 791.89K | 1.32M | 2.27M | 2.96M | 3.14M | 1.70M | 1.52M | 2.66M | 2.20M | 769.94K | 333.65K | 0.00 | 0.00 | 0.00 | 0.00 | 0.00 |
| Interest Expense | 1.33M | 707.49K | 407.62K | 3.75M | 4.82M | 1.87M | 2.28M | 1.83M | 2.21M | 3.48M | 4.40M | 2.78M | 1.95M | 2.92M | 1.81M | 2.02M | 1.21M | 0.00 | 0.00 | 0.00 |
| Depreciation & Amortization | 11.91M | 12.25M | 9.64M | 7.62M | 8.17M | 4.17M | 4.45M | 4.53M | 5.79M | 5.57M | 7.71M | 4.98M | 4.70M | 4.71M | 3.44M | 1.98M | 1.45M | 0.00 | 0.00 | 0.00 |
| EBITDA | 16.71M | -379.32K | 41.85M | -5.28M | 909.54K | 26.00M | -21.30M | 7.84M | 1.84M | 10.82M | -7.44M | 15.59M | 16.31M | 7.09M | 6.54M | 8.60M | 7.32M | 2.86M | -50.31K | -23.50K |
| EBITDA Ratio | 13.52% | -0.90% | -32.10% | -22.20% | -10.45% | 4.33% | -23.88% | -2.28% | 10.08% | 10.11% | 9.74% | 20.68% | 24.59% | 20.30% | 17.87% | 20.77% | 17.20% | 0.00% | 0.00% | 0.00% |
| Operating Income | -13.05M | -22.70M | -45.83M | -12.29M | 1.70M | -1.64M | -26.08M | -31.02M | -3.95M | 5.24M | 1.56M | 5.31M | 3.04M | 3.22M | 2.28M | 6.44M | 5.19M | -6.14K | -50.31K | -23.50K |
| Operating Income Ratio | -10.56% | -19.27% | -50.10% | -15.98% | 1.25% | -1.46% | -25.37% | -23.95% | -1.97% | 3.08% | 1.65% | 8.23% | 7.56% | 7.51% | 6.73% | 15.90% | 14.95% | 0.00% | 0.00% | 0.00% |
| Total Other Income/Expenses | 16.52M | 14.34M | 27.87M | -16.20M | -8.79M | 3.71M | -5.53M | 25.19M | 24.75M | 9.44M | -21.10M | 2.26M | 6.63M | -3.77M | -989.18K | -1.84M | -222.28K | 1.08M | 0.00 | 0.00 |
| Income Before Tax | 3.47M | -13.34M | 29.21M | -15.44M | -7.88M | 2.08M | -31.61M | -5.83M | 20.79M | 14.69M | -19.55M | 7.57M | 9.67M | -545.73K | 1.29M | 4.60M | 4.66M | 0.00 | 0.00 | 0.00 |
| Income Before Tax Ratio | 2.81% | -11.32% | 31.93% | -20.07% | -5.81% | 1.85% | -30.75% | -4.50% | 10.34% | 8.63% | -20.68% | 11.74% | 24.06% | -1.27% | 3.81% | 11.36% | 13.42% | 0.00% | 0.00% | 0.00% |
| Income Tax Expense | 1.80M | -487.51K | 6.35M | -5.05M | -692.26K | 7.77M | -3.26M | 681.55K | 6.13M | 2.41M | 1.59M | 1.52M | 551.06K | 405.71K | 287.58K | 9.61K | -372.51K | 6.14K | 50.31K | 23.50K |
| Net Income | 7.13K | -12.85M | 22.86M | -10.39M | -7.19M | -5.69M | -28.35M | -6.51M | 14.67M | 12.27M | -21.14M | 6.05M | 9.11M | -951.44K | 999.80K | 4.92M | 5.03M | -6.14K | -50.31K | -23.50K |
| Net Income Ratio | 0.01% | -10.91% | 24.99% | -13.51% | -5.30% | -5.06% | -27.57% | -5.03% | 7.29% | 7.21% | -22.36% | 9.38% | 22.69% | -2.22% | 2.96% | 12.15% | 14.49% | 0.00% | 0.00% | 0.00% |
| EPS | 0.00 | -0.17 | 0.30 | -0.19 | -0.14 | -0.11 | -0.59 | -0.14 | 0.31 | 0.29 | -0.61 | 0.21 | 0.33 | -0.04 | 0.05 | 0.25 | 0.31 | 0.00 | 0.00 | 0.00 |
| EPS Diluted | 0.00 | -0.17 | 0.30 | -0.19 | -0.14 | -0.11 | -0.59 | -0.14 | 0.31 | 0.29 | -0.61 | 0.20 | 0.32 | -0.04 | 0.05 | 0.25 | 0.31 | 0.00 | 0.00 | 0.00 |
| Weighted Avg Shares Out | 78.78M | 75.57M | 76.15M | 55.96M | 52.34M | 51.19M | 47.94M | 46.51M | 46.74M | 42.58M | 34.66M | 29.44M | 27.44M | 22.17M | 19.96M | 19.96M | 16.06M | 19.96M | 23.00M | 23.00M |
| Weighted Avg Shares Out (Dil) | 79.90M | 75.57M | 76.15M | 55.96M | 52.34M | 51.19M | 47.94M | 47.45M | 46.93M | 42.72M | 34.71M | 29.68M | 28.74M | 22.17M | 21.48M | 19.96M | 16.06M | 27.96M | 23.00M | 23.00M |

Kandi America Introduces the K32 Luxury Off-road Electric UTV

Kandi America Introduces the K32 Luxury Off-road Electric UTV

Why Kandi Technologies Stock Is Slumping Today

Kandi Technologies Group, Inc. (KNDI) CEO Xiaoming Hu on Q3 2021 Results - Earnings Call Transcript

Kandi Technologies Reports Third Quarter 2021 Financial Results

Kandi Technologies to Report Third Quarter 2021 Financial Results and Hold a Conference Call on November 9, 2021

Charging Up Your Portfolio with Electric Vehicles

Kandi Receives Final Payment from Fengsheng Sale

Kandi Technologies Stock Jumps On Solid Q2 Aided By Strength In EV Scooters

Kandi Technologies Group, Inc. (KNDI) CEO Xiaoming Hu on Q2 2021 Results - Earnings Call Transcript
Source: https://incomestatements.info
Category: Stock Reports
