See more : Gelesis Holdings, Inc. (GLSHQ) Income Statement Analysis – Financial Results
Complete financial analysis of Lakeland Bancorp, Inc. (LBAI) income statement, including revenue, profit margins, EPS and key performance metrics. Get detailed insights into the financial performance of Lakeland Bancorp, Inc., a leading company in the Banks – Regional industry within the Financial Services sector.
- Poddar Pigments Limited (PODDARMENT.NS) Income Statement Analysis – Financial Results
- Peugeot Invest Société anonyme (0HV8.L) Income Statement Analysis – Financial Results
- PT Inti Bangun Sejahtera Tbk (IBST.JK) Income Statement Analysis – Financial Results
- Carmit Candy Industries Ltd. (CRMT.TA) Income Statement Analysis – Financial Results
- SWK Holdings Corporation (SWKH) Income Statement Analysis – Financial Results
Lakeland Bancorp, Inc. (LBAI)
About Lakeland Bancorp, Inc.
Lakeland Bancorp, Inc. operates as the bank holding company for Lakeland Bank that offers various banking products and services for individuals and small to medium sized businesses. The company provides commercial banking services, including savings, money market, and time accounts, as well as demand deposits. It is also involved in lending services, including commercial real estate loans, commercial and industrial loans, short and medium term loans, lines of credit, letters of credit, inventory and accounts receivable financing, real estate construction loans, residential mortgage loans, Small Business Administration (SBA) loans, and merchant credit card services; financing solutions to small and medium-sized companies; online banking, mobile banking, and wire transfer services; and cash management services, such as remote capture of deposits and overnight sweep repurchase agreements. In addition, it provides consumer banking services, which include checking accounts, savings accounts, interest-bearing checking accounts, money market accounts, certificates of deposit, online banking, secured and unsecured loans, consumer installment loans, mortgage loans, and safe deposit services. Further, the company offers investment advisory services for individuals and businesses; and securities brokerage services, including mutual funds and variable annuities, as well as commercial title insurance services and life insurance products. As of December 31, 2021, it operated 48 branch offices located throughout Bergen, Essex, Morris, Ocean, Passaic, Somerset, Sussex, and Union counties in New Jersey and in Highland Mills, New York; operated six New Jersey regional commercial lending centers in Bernardsville, Iselin, Jackson, Montville, Teaneck and Waldwick; and one New York commercial lending center to serve the Hudson Valley region. The company was incorporated in 1969 and is headquartered in Oak Ridge, New Jersey.
| Metric | 2023 | 2022 | 2021 | 2020 | 2019 | 2018 | 2017 | 2016 | 2015 | 2014 | 2013 | 2012 | 2011 | 2010 | 2009 | 2008 | 2007 | 2006 | 2005 | 2004 | 2003 | 2002 | 2001 | 2000 | 1999 | 1998 | 1997 | 1996 | 1995 |
|---|---|---|---|---|---|---|---|---|---|---|---|---|---|---|---|---|---|---|---|---|---|---|---|---|---|---|---|---|---|
| Revenue | 514.58M | 340.71M | 257.20M | 232.47M | 220.45M | 193.67M | 188.62M | 165.40M | 134.57M | 131.29M | 124.31M | 114.42M | 115.53M | 119.02M | 112.24M | 106.19M | 90.36M | 80.88M | 84.75M | 74.90M | 63.48M | 58.05M | 48.78M | 44.23M | 40.11M | 25.10M | 2.90M | 2.77M | 2.11M |
| Cost of Revenue | 0.00 | 31.59M | 23.82M | 0.00 | 0.00 | 0.00 | 0.00 | 0.00 | 0.00 | 0.00 | 0.00 | 0.00 | 0.00 | 0.00 | 0.00 | 0.00 | 0.00 | 0.00 | 0.00 | 0.00 | 0.00 | 0.00 | 0.00 | 0.00 | 0.00 | 0.00 | 0.00 | 0.00 | 0.00 |
| Gross Profit | 514.58M | 309.12M | 233.38M | 232.47M | 220.45M | 193.67M | 188.62M | 165.40M | 134.57M | 131.29M | 124.31M | 114.42M | 115.53M | 119.02M | 112.24M | 106.19M | 90.36M | 80.88M | 84.75M | 74.90M | 63.48M | 58.05M | 48.78M | 44.23M | 40.11M | 25.10M | 2.90M | 2.77M | 2.11M |
| Gross Profit Ratio | 100.00% | 90.73% | 90.74% | 100.00% | 100.00% | 100.00% | 100.00% | 100.00% | 100.00% | 100.00% | 100.00% | 100.00% | 100.00% | 100.00% | 100.00% | 100.00% | 100.00% | 100.00% | 100.00% | 100.00% | 100.00% | 100.00% | 100.00% | 100.00% | 100.00% | 100.00% | 100.00% | 100.00% | 100.00% |
| Research & Development | 0.00 | 0.00 | 0.00 | 0.00 | 0.00 | 0.00 | 0.00 | 0.00 | 0.00 | 0.00 | 0.00 | 0.00 | 0.00 | 0.00 | 0.00 | 0.00 | 0.00 | 0.00 | 0.00 | 0.00 | 0.00 | 0.00 | 0.00 | 0.00 | 0.00 | 0.00 | 0.00 | 0.00 | 0.00 |
| General & Administrative | 114.17M | 110.89M | 84.93M | 86.07M | 81.26M | 73.60M | 66.15M | 61.71M | 53.70M | 48.59M | 45.37M | 42.16M | 40.69M | 43.18M | 41.93M | 32.26M | 32.86M | 30.84M | 28.51M | 25.13M | 20.68M | 18.49M | 17.26M | 15.00M | 14.90M | 8.50M | 6.11M | 5.46M | 5.30M |
| Selling & Marketing | 2.24M | 2.52M | 1.64M | 1.25M | 1.95M | 1.44M | 1.68M | 1.67M | 1.59M | 2.03M | 2.09M | 2.03M | 2.41M | 2.70M | 2.63M | 2.35M | 1.83M | 1.57M | 1.63M | 1.47M | 1.08M | 0.00 | 0.00 | 0.00 | 0.00 | 0.00 | 0.00 | 0.00 | 0.00 |
| SG&A | 116.40M | 110.89M | 84.93M | 87.33M | 83.21M | 75.03M | 67.82M | 63.39M | 55.29M | 50.61M | 47.46M | 44.20M | 43.10M | 45.88M | 44.56M | 34.61M | 34.69M | 32.41M | 30.14M | 26.60M | 21.76M | 18.49M | 17.26M | 15.00M | 14.90M | 8.50M | 6.11M | 5.46M | 5.30M |
| Other Expenses | -41.93M | 116.87M | -214.79M | -245.02M | -209.71M | -152.47M | -22.03M | -21.76M | 0.00 | 0.00 | 0.00 | 0.00 | 0.00 | 128.00K | 940.00K | 0.00 | 0.00 | 0.00 | 0.00 | 0.00 | 0.00 | -45.23M | -27.24M | -22.80M | -26.66M | -12.00M | 9.37M | 9.17M | 8.79M |
| Operating Expenses | 41.93M | 227.76M | -129.86M | -157.69M | -126.51M | -73.82M | 1.68M | 1.67M | 1.59M | 2.03M | 2.09M | 2.03M | 2.41M | 2.70M | 2.63M | 2.35M | 1.83M | 1.57M | 1.63M | 1.47M | 1.08M | -26.74M | -9.98M | -7.81M | -11.76M | -3.50M | 15.49M | 14.62M | 14.09M |
| Cost & Expenses | 402.92M | 31.59M | -129.86M | -157.69M | -126.51M | -73.82M | 1.68M | 1.67M | 1.59M | 2.03M | 2.09M | 2.03M | 2.41M | 2.57M | 1.69M | 2.35M | 1.83M | 1.57M | 1.63M | 1.47M | 1.08M | -26.74M | -9.98M | -7.81M | -11.76M | -3.50M | 15.49M | 14.62M | 14.09M |
| Interest Income | 491.04M | 367.54M | 257.32M | 248.84M | 256.49M | 213.12M | 190.20M | 163.30M | 127.51M | 122.50M | 114.20M | 110.96M | 117.52M | 125.65M | 133.82M | 143.94M | 136.38M | 119.81M | 103.84M | 83.32M | 66.92M | 65.52M | 63.32M | 58.21M | 54.03M | 34.90M | 44.10M | 25.47M | 23.85M |
| Interest Expense | 12.70M | 54.93M | 22.48M | 41.16M | 60.45M | 39.56M | 24.97M | 17.65M | 10.87M | 8.94M | 9.66M | 15.45M | 20.11M | 25.90M | 40.44M | 55.36M | 64.65M | 53.10M | 33.63M | 21.82M | 16.22M | 17.35M | 22.83M | 21.72M | 20.24M | 13.00M | 10.52M | 9.70M | 9.11M |
| Depreciation & Amortization | 11.76M | 16.81M | 8.26M | 1.03M | 1.18M | 594.00K | 654.00K | 734.00K | 415.00K | 464.00K | 288.00K | 3.07M | 577.00K | 1.06M | 1.06M | 4.46M | 5.79M | 5.30M | 9.34M | 7.98M | 8.66M | 4.92M | 2.23M | 2.17M | 2.90M | 1.60M | 875.61K | 800.93K | 882.15K |
| EBITDA | 0.00 | 0.00 | 0.00 | 0.00 | 0.00 | 0.00 | 0.00 | 0.00 | 0.00 | 0.00 | 0.00 | 0.00 | 0.00 | 0.00 | 0.00 | 0.00 | 0.00 | 0.00 | 0.00 | 0.00 | 0.00 | 0.00 | 0.00 | 0.00 | 0.00 | 0.00 | 0.00 | 0.00 | 0.00 |
| EBITDA Ratio | 2.12% | 63.32% | 52.72% | 32.61% | 43.15% | 65.06% | 58.43% | 51.50% | 47.07% | 45.05% | 41.02% | 44.01% | 45.14% | 49.87% | 28.19% | 77.42% | 106.95% | 102.42% | 85.87% | 71.97% | 74.17% | 62.41% | 84.13% | 87.26% | 77.91% | 92.43% | 663.28% | 657.25% | 808.88% |
| Operating Income | 472.65M | 198.92M | 127.34M | 74.78M | 93.94M | 119.85M | 109.55M | 84.45M | 62.93M | 58.68M | 50.70M | 47.28M | 51.58M | 58.29M | 30.58M | 77.75M | 90.84M | 77.54M | 63.44M | 45.93M | 38.42M | 31.31M | 38.81M | 36.42M | 28.36M | 21.60M | 18.39M | 17.39M | 16.20M |
| Operating Income Ratio | 91.85% | 58.38% | 49.51% | 32.17% | 42.61% | 61.88% | 58.08% | 51.06% | 46.76% | 44.69% | 40.79% | 41.33% | 44.64% | 48.98% | 27.24% | 73.21% | 100.54% | 95.87% | 74.85% | 61.32% | 60.52% | 53.94% | 79.55% | 82.35% | 70.69% | 86.06% | 633.13% | 628.31% | 767.10% |
| Total Other Income/Expenses | 110.79M | 143.99M | 127.34M | 74.78M | 93.94M | 80.29M | 80.05M | 62.84M | -3.98M | -2.72M | -5.17M | -3.04M | -23.02M | -28.96M | -13.17M | -55.36M | -64.65M | -53.10M | -33.63M | -21.82M | -16.22M | -17.35M | -22.83M | -21.72M | -20.24M | -13.00M | -10.52M | -9.70M | -9.11M |
| Income Before Tax | 110.79M | 143.99M | 127.34M | 74.78M | 93.94M | 80.29M | 80.05M | 62.84M | 48.65M | 46.29M | 37.42M | 31.84M | 28.56M | 29.34M | -13.17M | 22.39M | 26.19M | 24.44M | 29.81M | 24.11M | 22.19M | 13.96M | 15.98M | 14.70M | 8.11M | 8.60M | 7.87M | 7.70M | 7.08M |
| Income Before Tax Ratio | 21.53% | 42.26% | 49.51% | 32.17% | 42.61% | 41.46% | 42.44% | 37.99% | 36.15% | 35.26% | 30.10% | 27.83% | 24.72% | 24.65% | -11.74% | 21.08% | 28.98% | 30.21% | 35.17% | 32.19% | 34.96% | 24.05% | 32.75% | 33.24% | 20.23% | 34.26% | 270.93% | 278.03% | 335.45% |
| Income Tax Expense | 26.05M | 36.62M | 32.29M | 17.26M | 23.27M | 16.89M | 27.47M | 21.32M | 16.17M | 15.16M | 12.45M | 10.10M | 8.71M | 10.13M | -7.78M | 7.22M | 8.20M | 7.46M | 9.58M | 7.62M | 7.09M | 3.89M | 4.95M | 4.70M | 2.71M | 2.90M | 2.70M | 2.63M | 2.29M |
| Net Income | 84.74M | 107.37M | 95.04M | 57.52M | 70.67M | 63.40M | 52.58M | 41.52M | 32.48M | 31.13M | 24.97M | 21.74M | 19.85M | 19.21M | -5.40M | 15.17M | 17.99M | 16.98M | 20.22M | 16.50M | 15.11M | 10.08M | 11.02M | 10.01M | 5.40M | 5.70M | 5.17M | 5.06M | 4.80M |
| Net Income Ratio | 16.47% | 31.51% | 36.95% | 24.74% | 32.06% | 32.74% | 27.88% | 25.10% | 24.14% | 23.71% | 20.09% | 19.00% | 17.18% | 16.14% | -4.81% | 14.28% | 19.91% | 20.99% | 23.86% | 22.02% | 23.80% | 17.36% | 22.60% | 22.62% | 13.46% | 22.71% | 178.09% | 182.86% | 227.15% |
| EPS | 1.29 | 1.64 | 1.85 | 1.13 | 1.39 | 1.33 | 1.10 | 0.96 | 0.85 | 0.82 | 0.71 | 0.72 | 0.63 | 0.52 | -0.20 | 0.56 | 0.67 | 0.63 | 0.71 | 0.57 | 0.74 | 0.50 | 0.54 | 0.46 | 0.26 | 0.41 | 0.47 | 0.46 | 0.46 |
| EPS Diluted | 1.29 | 1.63 | 1.85 | 1.13 | 1.38 | 1.33 | 1.09 | 0.95 | 0.85 | 0.82 | 0.71 | 0.72 | 0.63 | 0.52 | -0.20 | 0.55 | 0.67 | 0.63 | 0.70 | 0.57 | 0.73 | 0.49 | 0.53 | 0.46 | 0.26 | 0.41 | 0.47 | 0.46 | 0.46 |
| Weighted Avg Shares Out | 65.04M | 64.62M | 50.62M | 50.54M | 50.48M | 47.57M | 47.44M | 42.91M | 37.84M | 37.75M | 34.74M | 29.00M | 27.90M | 29.05M | 27.40M | 27.16M | 26.70M | 26.80M | 28.68M | 28.71M | 20.45M | 20.26M | 20.36M | 21.56M | 20.43M | 13.20M | 11.04M | 10.90M | 10.51M |
| Weighted Avg Shares Out (Dil) | 65.22M | 64.92M | 50.87M | 50.65M | 50.64M | 47.76M | 47.67M | 43.11M | 37.99M | 37.87M | 34.90M | 29.08M | 28.02M | 29.09M | 27.40M | 27.26M | 27.04M | 26.80M | 29.00M | 29.09M | 20.66M | 20.55M | 20.62M | 21.86M | 20.94M | 13.20M | 11.04M | 10.90M | 10.51M |

Lakeland Bancorp's (LBAI) Shares March Higher, Can It Continue?

Lakeland Bancorp (LBAI) Tops Q4 Earnings and Revenue Estimates

Analysts Estimate Lakeland Bancorp (LBAI) to Report a Decline in Earnings: What to Look Out for

Brokerages Expect Lakeland Bancorp, Inc. (NASDAQ:LBAI) Will Post Quarterly Sales of $58.52 Million

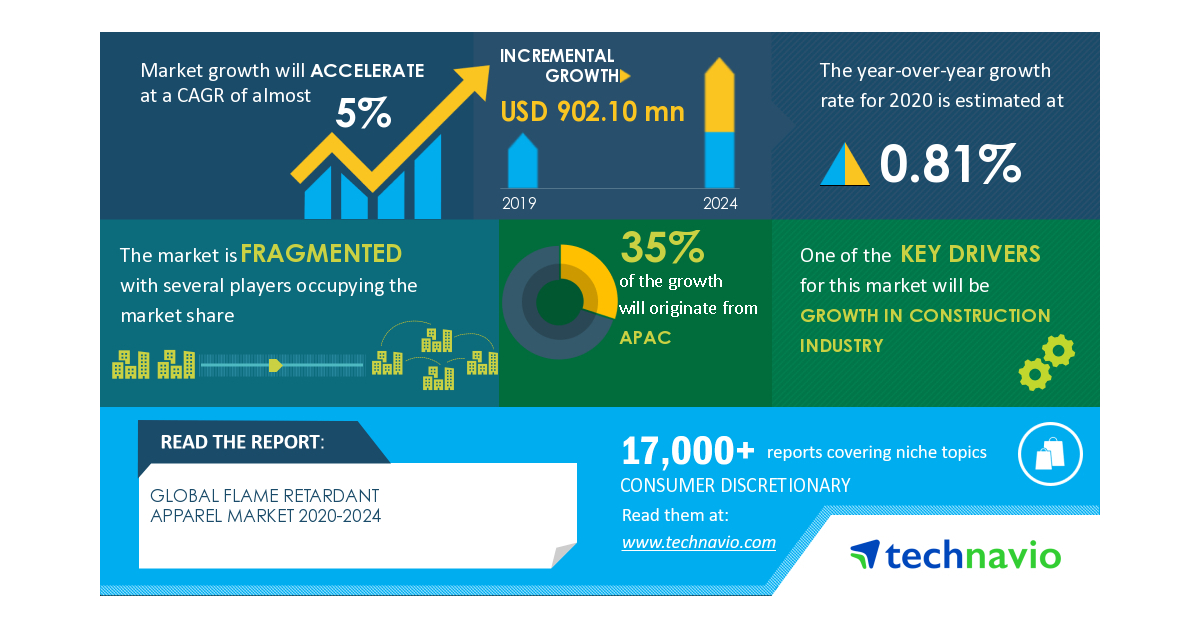
Flame Retardant Apparel Market | Growth in Construction Industry to Boost the Market Growth | Technavio

Buy These 5 Low-Beta Stocks to Survive the Choppy Market

Handelsbanken Fonder AB Makes New $197,000 Investment in Lakeland Bancorp, Inc. (NASDAQ:LBAI)

Can you afford to leave 5p/L behind you?

Engineers Gate Manager LP Invests $357,000 in Lakeland Bancorp, Inc. (NASDAQ:LBAI)
Source: https://incomestatements.info
Category: Stock Reports

