See more : PT AKR Corporindo Tbk (PKCPY) Income Statement Analysis – Financial Results
Complete financial analysis of London Stock Exchange Group plc (LDNXF) income statement, including revenue, profit margins, EPS and key performance metrics. Get detailed insights into the financial performance of London Stock Exchange Group plc, a leading company in the Financial – Data & Stock Exchanges industry within the Financial Services sector.
- Bukit Jalil Global Acquisition 1 Ltd (BUJAR) Income Statement Analysis – Financial Results
- Public Joint stock company Rosseti Centre and Volga region (MRKP.ME) Income Statement Analysis – Financial Results
- Choice Hotels International, Inc. (CHH) Income Statement Analysis – Financial Results
- AstraZeneca PLC (AZNCF) Income Statement Analysis – Financial Results
- Lindsay Australia Limited (LAU.AX) Income Statement Analysis – Financial Results
London Stock Exchange Group plc (LDNXF)
About London Stock Exchange Group plc
London Stock Exchange Group plc engages in the market infrastructure business primarily in the United Kingdom, the United States, other European countries, Asia, and internationally. The company operates through three segments: Data & Analytics, Capital Markets, and Post Trade. It operates a range of international equity, fixed income, exchange-traded funds/exchange-trading, and foreign exchange markets, including London Stock Exchange, AIM, Turquoise, CurveGlobal, FXall, and Tradeweb. The company also provides information and data products, such as indexes, benchmarks, real time pricing data and trade reporting, and reconciliation services, as well as network connectivity and server hosting services; market trading services; and clearing, risk management, capital optimization, and regulatory reporting solutions. In addition, it offers media training, events space, and studio hire services. Further, the company licenses capital markets; installs software; and provides maintenance services. London Stock Exchange Group plc was founded in 1698 and is headquartered in London, the United Kingdom.
| Metric | 2023 | 2022 | 2021 | 2020 | 2019 | 2018 | 2017 | 2016 | 2015 | 2014 | 2013 | 2012 | 2011 | 2010 | 2009 | 2008 | 2007 | 2006 | 2005 | 2004 | 2003 | 2002 | 2001 | 2000 | 1999 |
|---|---|---|---|---|---|---|---|---|---|---|---|---|---|---|---|---|---|---|---|---|---|---|---|---|---|
| Revenue | 8.38B | 7.74B | 6.71B | 2.44B | 2.31B | 2.13B | 1.93B | 1.64B | 1.41B | 1.20B | 843.10M | 814.80M | 674.90M | 628.30M | 671.40M | 546.40M | 349.60M | 297.50M | 244.40M | 237.10M | 225.90M | 206.60M | 188.40M | 171.20M | 155.30M |
| Cost of Revenue | 1.14B | 1.06B | 862.00M | 224.00M | 210.00M | 227.00M | 583.00M | 503.60M | 447.90M | 311.70M | 188.10M | 0.00 | 0.00 | 0.00 | 0.00 | 0.00 | 0.00 | 0.00 | 0.00 | 0.00 | 0.00 | 0.00 | 0.00 | 0.00 | 0.00 |
| Gross Profit | 7.24B | 6.68B | 5.85B | 2.22B | 2.10B | 1.90B | 1.35B | 1.14B | 962.50M | 886.40M | 655.00M | 814.80M | 674.90M | 628.30M | 671.40M | 546.40M | 349.60M | 297.50M | 244.40M | 237.10M | 225.90M | 206.60M | 188.40M | 171.20M | 155.30M |
| Gross Profit Ratio | 86.36% | 86.26% | 87.15% | 90.83% | 90.91% | 89.34% | 69.79% | 69.30% | 68.24% | 73.98% | 77.69% | 100.00% | 100.00% | 100.00% | 100.00% | 100.00% | 100.00% | 100.00% | 100.00% | 100.00% | 100.00% | 100.00% | 100.00% | 100.00% | 100.00% |
| Research & Development | 10.00M | 11.00M | 0.13 | 162.00M | 0.28 | 0.00 | 0.00 | 0.00 | 0.00 | 0.00 | 0.00 | 0.00 | 0.00 | 0.00 | 0.00 | 0.00 | 0.00 | 0.00 | 0.00 | 0.00 | 0.00 | 0.00 | 0.00 | 0.00 | 0.00 |
| General & Administrative | 404.00M | 420.00M | 333.00M | 60.00M | 49.00M | 0.00 | 0.00 | 0.00 | 0.00 | 0.00 | 0.00 | 0.00 | 0.00 | 0.00 | 0.00 | 0.00 | 0.00 | 0.00 | 0.00 | 0.00 | 0.00 | 0.00 | 0.00 | 0.00 | 0.00 |
| Selling & Marketing | 0.00 | 0.00 | 0.00 | 0.00 | 0.00 | 0.00 | 0.00 | 0.00 | 0.00 | 0.00 | 0.00 | 0.00 | 0.00 | 0.00 | 0.00 | 0.00 | 0.00 | 0.00 | 0.00 | 0.00 | 0.00 | 0.00 | 0.00 | 0.00 | 0.00 |
| SG&A | 404.00M | 420.00M | 333.00M | 60.00M | 49.00M | 0.00 | 0.00 | 0.00 | 0.00 | 0.00 | 60.00M | 0.00 | 0.00 | 0.00 | 0.00 | 0.00 | 0.00 | 0.00 | 0.00 | 0.00 | 0.00 | 0.00 | 0.00 | 0.00 | 0.00 |
| Other Expenses | 5.45B | 34.00M | 31.00M | 1.00M | 3.00M | 6.00M | 25.00M | 16.70M | 8.20M | 11.50M | 9.80M | -651.60M | -13.10M | -7.00M | -6.10M | 13.20M | -1.90M | -1.20M | -1.10M | -1.40M | -1.10M | 0.00 | -16.80M | 5.20M | 6.70M |
| Operating Expenses | 5.87B | 5.04B | 4.41B | 1.29B | 1.24B | 1.13B | 704.00M | 619.40M | 535.60M | 814.90M | 522.80M | 350.90M | 367.00M | 468.60M | 1.38B | 283.50M | 186.80M | 253.20M | 160.00M | 155.80M | 167.50M | 136.10M | 112.90M | 129.40M | 131.30M |
| Cost & Expenses | 7.01B | 6.10B | 5.27B | 1.51B | 1.45B | 1.36B | 1.29B | 1.12B | 983.50M | 814.90M | 522.80M | 350.90M | 367.00M | 468.60M | 1.38B | 283.50M | 186.80M | 253.20M | 160.00M | 155.80M | 167.50M | 136.10M | 112.90M | 129.40M | 131.30M |
| Interest Income | 94.00M | 111.00M | 5.00M | 4.00M | 9.00M | 8.00M | 3.00M | 1.00M | 900.00K | 5.20M | 2.40M | 3.60M | 1.30M | 2.50M | 7.50M | 6.30M | 4.80M | 9.40M | 9.00M | 8.00M | 9.30M | 8.50M | 12.40M | 11.10M | 12.80M |
| Interest Expense | 281.00M | 241.00M | 198.00M | 60.00M | 77.00M | 73.00M | 65.00M | 66.30M | 67.20M | 72.00M | 62.00M | 41.30M | 43.00M | 41.70M | 41.80M | 34.80M | 17.80M | 800.00K | 2.50M | 1.90M | 900.00K | 1.20M | 4.50M | 4.80M | 5.20M |
| Depreciation & Amortization | 2.14B | 1.89B | 1.57B | 340.00M | 369.00M | 287.00M | 255.00M | 233.40M | 217.40M | 178.60M | 129.20M | 95.30M | 96.70M | 123.00M | 85.80M | 48.40M | 24.10M | 26.50M | 28.70M | 23.50M | 19.90M | 18.30M | 19.90M | 22.20M | 33.10M |
| EBITDA | 3.62B | 3.32B | 2.66B | 891.00M | 1.10B | 1.05B | 885.00M | 673.00M | 620.70M | 576.50M | 535.10M | 478.30M | -291.30M | 398.80M | 346.80M | -108.00M | 312.50M | 203.40M | 120.80M | 123.40M | 112.60M | 100.20M | 94.70M | 54.80M | 75.50M |
| EBITDA Ratio | 43.19% | 46.69% | 46.68% | 53.99% | 54.31% | 50.40% | 47.56% | 47.21% | 46.19% | 48.12% | 55.96% | -74.37% | -43.16% | -62.39% | -267.50% | -42.04% | -49.80% | -90.02% | -53.76% | -56.47% | -70.52% | 47.58% | 48.46% | 47.08% | 49.58% |
| Operating Income | 1.37B | 1.42B | 1.16B | 755.00M | 738.00M | 751.00M | 626.00M | 426.80M | 404.40M | 353.10M | 348.40M | 358.50M | 283.00M | 182.30M | -207.90M | 265.20M | 174.20M | 85.40M | 84.50M | 81.30M | 70.00M | 66.90M | 39.00M | 36.70M | 3.40M |
| Operating Income Ratio | 16.36% | 18.30% | 17.26% | 30.90% | 31.93% | 35.27% | 32.44% | 26.02% | 28.67% | 29.47% | 41.32% | 44.00% | 41.93% | 29.01% | -30.97% | 48.54% | 49.83% | 28.71% | 34.57% | 34.29% | 30.99% | 32.38% | 20.70% | 21.44% | 2.19% |
| Total Other Income/Expenses | -176.00M | -396.00M | -78.00M | 123.00M | -271.00M | -102.00M | -103.00M | -177.00M | -99.40M | -144.55M | -68.80M | 300.30M | -120.30M | -44.80M | -38.00M | -516.00M | -38.20M | -80.70M | 6.80M | 4.30M | -1.80M | 5.20M | -36.50M | 9.50M | -18.60M |
| Income Before Tax | 1.20B | 1.24B | 987.00M | 685.00M | 651.00M | 685.00M | 564.00M | 364.10M | 336.10M | 284.30M | 298.90M | 639.70M | 238.20M | 144.30M | -250.80M | 227.00M | 161.50M | 93.50M | 92.20M | 88.80M | 79.50M | 75.20M | 30.40M | 48.50M | 18.10M |
| Income Before Tax Ratio | 14.26% | 16.03% | 14.71% | 28.04% | 28.17% | 32.17% | 29.22% | 22.20% | 23.83% | 23.73% | 35.45% | 78.51% | 35.29% | 22.97% | -37.35% | 41.54% | 46.20% | 31.43% | 37.73% | 37.45% | 35.19% | 36.40% | 16.14% | 28.33% | 11.65% |
| Income Tax Expense | 247.00M | 262.00M | 327.00M | 198.00M | 186.00M | 132.00M | -22.00M | 101.60M | 48.10M | 101.60M | 83.40M | 108.30M | 81.70M | 52.60M | 82.00M | 54.00M | 50.90M | 26.70M | 27.70M | 25.70M | 26.80M | 25.30M | 15.20M | 16.40M | 7.10M |
| Net Income | 761.00M | 1.30B | 3.13B | 421.00M | 417.00M | 480.00M | 505.00M | 151.90M | 328.30M | 170.10M | 217.00M | 522.00M | 151.60M | 90.40M | -338.00M | 168.30M | 109.60M | 70.70M | 65.00M | 63.40M | 52.70M | 49.90M | 15.20M | 32.10M | 11.00M |
| Net Income Ratio | 9.08% | 16.83% | 46.64% | 17.23% | 18.04% | 22.55% | 26.17% | 9.26% | 23.28% | 14.20% | 25.74% | 64.06% | 22.46% | 14.39% | -50.34% | 30.80% | 31.35% | 23.76% | 26.60% | 26.74% | 23.33% | 24.15% | 8.07% | 18.75% | 7.08% |
| EPS | 1.38 | 1.52 | 1.13 | 1.20 | 1.19 | 1.38 | 1.46 | 0.44 | 0.95 | 0.58 | 0.74 | 1.78 | 0.52 | 0.31 | -1.16 | 0.65 | 0.47 | 0.26 | 0.22 | 0.23 | 0.19 | 0.18 | 0.04 | 0.12 | 0.05 |
| EPS Diluted | 1.38 | 1.51 | 1.13 | 1.19 | 1.18 | 1.36 | 1.43 | 0.43 | 0.93 | 0.57 | 0.73 | 1.76 | 0.51 | 0.31 | -1.16 | 0.64 | 0.46 | 0.25 | 0.22 | 0.23 | 0.19 | 0.18 | 0.04 | 0.12 | 0.05 |
| Weighted Avg Shares Out | 551.05M | 557.00M | 538.00M | 350.00M | 349.00M | 347.00M | 345.00M | 348.90M | 347.00M | 293.22M | 292.90M | 292.68M | 291.59M | 290.51M | 290.51M | 258.16M | 235.79M | 276.07M | 292.03M | 272.64M | 272.55M | 271.53M | 271.53M | 276.36M | 276.36M |
| Weighted Avg Shares Out (Dil) | 551.00M | 560.00M | 541.00M | 354.00M | 353.00M | 353.00M | 353.00M | 355.90M | 352.10M | 300.82M | 298.11M | 296.80M | 294.63M | 293.11M | 291.05M | 262.28M | 240.79M | 280.52M | 295.18M | 275.15M | 272.83M | 273.48M | 276.36M | 276.36M | 276.36M |

U.K. Police Arrest Six in Plot to Disrupt London Stock Exchange

U.K. Police Arrest Six People in Plan to Disrupt London Stock Exchange

Tui board recommends delisting from London Stock Exchange

Trading in U.K. small-caps halted as London Stock Exchange suffers third outage in as many months
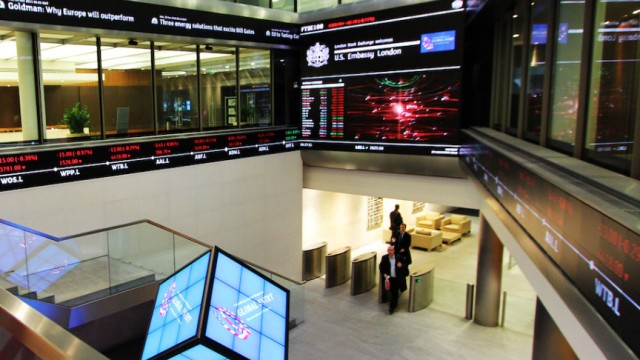
LSE Group trading affected on London Stock Exchange

Delisting and Cancellation of Trading From the London Stock Exchange
London Stock Exchange Group has improved Refinitiv since acquisition - analyst

London Stock Exchange Group to launch £1 billion share buyback as it capitalizes on data push
London Stock Exchange Group announces £1 billion in shareholder returns

London Stock Exchange's flourishing future: Driven by data and tech partnerships
Source: https://incomestatements.info
Category: Stock Reports
