See more : Korvest Ltd (KOV.AX) Income Statement Analysis – Financial Results
Complete financial analysis of Lagardere SA (LGDDF) income statement, including revenue, profit margins, EPS and key performance metrics. Get detailed insights into the financial performance of Lagardere SA, a leading company in the Travel Services industry within the Consumer Cyclical sector.
- Manaris (2010) Corp. (AVNY) Income Statement Analysis – Financial Results
- Global Partner Acquisition Corp II (GPACW) Income Statement Analysis – Financial Results
- Qian Jiang Water Resources Development Co.,Ltd (600283.SS) Income Statement Analysis – Financial Results
- Janux Therapeutics, Inc. (JANX) Income Statement Analysis – Financial Results
- Space Shuttle Hi-Tech Co., Ltd. (2440.TW) Income Statement Analysis – Financial Results
Lagardere SA (LGDDF)
About Lagardere SA
Lagardere SA engages in content publishing, production, broadcasting, and distribution businesses worldwide. It operates through two divisions: Lagardère Publishing, and Lagardère Travel Retail. The Lagardère Publishing division includes book publishing and e-publishing businesses, which cover the areas of education, general literature, illustrated books, partworks, dictionaries, youth works, mobile games, board games, and distribution in English, French, and Spanish languages. The Lagardère Travel Retail division is involved in retail activities in transit hubs and concessions in travel essentials, duty free and fashion, and food services fields. As of December 31, 2021, this segment operated 2,928 stores under its own international store names, such as Relay, Hubiz, 1Minute, Hub Convenience, Discover, Tech2go, Aelia Duty Free, The Fashion Gallery, The Fashion Place, Eye Love, So Chocolate, Bread&Co., Hello!, So! Coffee, Trib's, Vino Volo, Natoo, etc., as well as store names with a local identity comprising BuY Paris Duty Free, Casa Del Gusto, and The Belgian Chocolate House. It also operates stores under franchises or licenses, with retail partners that include TripAdvisor, Fnac, iStore, Marks & Spencer, Hermès, Victoria's Secret, Nespresso, Costa Coffee, Burger King, Dean & Deluca, Eric Kayser, and Paul. The company was formerly known as Lagardère SCA and changed its name to Lagardere SA in June 2021. The company was founded in 1826 and is headquartered in Paris, France.
| Metric | 2023 | 2022 | 2021 | 2020 | 2019 | 2018 | 2017 | 2016 | 2015 | 2014 | 2013 | 2012 | 2011 | 2010 | 2009 | 2008 | 2007 | 2006 | 2005 | 2004 |
|---|---|---|---|---|---|---|---|---|---|---|---|---|---|---|---|---|---|---|---|---|
| Revenue | 8.13B | 6.98B | 5.17B | 4.48B | 7.30B | 6.95B | 7.18B | 7.66B | 7.46B | 7.49B | 7.56B | 7.37B | 8.05B | 8.34B | 7.89B | 8.21B | 8.58B | 7.91B | 13.01B | 12.30B |
| Cost of Revenue | 4.74B | 6.64B | 5.20B | 4.87B | 6.95B | 4.09B | 3.78B | 4.22B | 4.23B | 4.47B | 4.63B | 3.48B | 3.61B | 3.55B | 3.65B | 0.00 | 3.89B | 3.58B | 6.86B | 6.62B |
| Gross Profit | 3.39B | 336.00M | -27.00M | -386.00M | 350.00M | 2.86B | 3.40B | 3.44B | 3.22B | 3.03B | 2.93B | 3.89B | 4.44B | 4.79B | 4.24B | 8.21B | 4.69B | 4.34B | 6.16B | 5.68B |
| Gross Profit Ratio | 41.70% | 4.82% | -0.52% | -8.62% | 4.80% | 41.19% | 47.33% | 44.93% | 43.24% | 40.38% | 38.78% | 52.75% | 55.21% | 57.43% | 53.71% | 100.00% | 54.64% | 54.80% | 47.32% | 46.19% |
| Research & Development | 0.00 | 0.00 | 0.00 | 0.00 | 0.00 | 0.00 | 0.00 | 0.00 | 0.00 | 0.00 | 0.00 | 0.00 | 0.00 | 0.00 | 0.00 | 0.00 | 0.00 | 0.00 | 0.00 | 0.00 |
| General & Administrative | 0.00 | 0.00 | 1.58B | 1.47B | 1.85B | 2.58B | 2.50B | 2.53B | 2.35B | 2.23B | 2.12B | 2.13B | 2.20B | 2.40B | 0.00 | 0.00 | 0.00 | 0.00 | 0.00 | 0.00 |
| Selling & Marketing | 0.00 | 0.00 | -1.56B | -1.40B | -1.82B | -715.00M | 25.00M | 0.00 | 0.00 | 0.00 | 0.00 | 0.00 | 0.00 | 2.40B | 2.29B | 0.00 | 0.00 | 0.00 | 0.00 | 0.00 |
| SG&A | 2.23B | 41.00M | 20.00M | 76.00M | 30.00M | 1.87B | 2.53B | 2.53B | 2.35B | 2.23B | 2.12B | 2.13B | 2.20B | 2.40B | 2.29B | 0.00 | 0.00 | 0.00 | 0.00 | 0.00 |
| Other Expenses | 0.00 | 38.00M | 44.00M | 21.00M | 64.00M | 75.00M | 37.00M | -36.00M | 18.00M | 0.00 | 0.00 | 1.43B | 1.92B | 1.96B | -121.00M | -7.39B | -46.00M | 16.00M | 94.00M | 54.00M |
| Operating Expenses | 2.23B | 3.00M | -24.00M | 55.00M | -34.00M | 2.42B | 3.13B | 3.11B | 3.05B | 2.82B | 1.41B | 3.56B | 4.13B | 4.36B | -121.00M | -7.39B | 4.15B | 3.85B | 5.26B | 4.69B |
| Cost & Expenses | 6.97B | 6.64B | 5.17B | 4.92B | 6.91B | 6.51B | 6.91B | 7.33B | 7.29B | 7.29B | 6.04B | 7.04B | 7.73B | 7.91B | -121.00M | -7.39B | 8.05B | 7.43B | 12.12B | 11.31B |
| Interest Income | 7.00M | 8.00M | 7.00M | 6.00M | 7.00M | 124.00M | 65.00M | 66.00M | 62.00M | 67.00M | 90.00M | 7.00M | 12.00M | 18.00M | 5.00M | 7.00M | 36.00M | 23.00M | 72.00M | 52.00M |
| Interest Expense | 200.00M | 142.00M | 139.00M | 139.00M | 143.00M | 133.00M | 83.00M | 76.00M | 68.00M | 73.00M | 95.00M | 93.00M | 112.00M | 100.00M | 87.00M | 183.00M | 211.00M | 169.00M | 171.00M | 176.00M |
| Depreciation & Amortization | 663.00M | 612.00M | 672.00M | 769.00M | 814.00M | 691.00M | 260.00M | 306.00M | 263.00M | 223.00M | 214.00M | 246.00M | 305.00M | 238.00M | 7.43B | 7.46B | 203.00M | 128.00M | 334.00M | 343.00M |
| EBITDA | 1.10B | 926.00M | 744.00M | 267.00M | 1.22B | 503.00M | 590.00M | 618.00M | 555.00M | 522.00M | 514.00M | 424.00M | 31.00M | 668.00M | 631.00M | 8.21B | 1.08B | 708.00M | 1.35B | 1.31B |
| EBITDA Ratio | 13.52% | 13.54% | 12.94% | 7.32% | 16.42% | 7.24% | 8.22% | 8.07% | 7.44% | 6.97% | 6.80% | 7.72% | 15.35% | 9.81% | 100.00% | 100.83% | 8.94% | 9.67% | 10.47% | 10.96% |
| Operating Income | 1.16B | 333.00M | -3.00M | -441.00M | 384.00M | 285.00M | 330.00M | 312.00M | 292.00M | 299.00M | 300.00M | 323.00M | 930.00M | 343.00M | 461.00M | 825.00M | 867.00M | 585.00M | 920.00M | 889.00M |
| Operating Income Ratio | 14.24% | 4.77% | -0.06% | -9.84% | 5.26% | 4.10% | 4.60% | 4.07% | 3.92% | 3.99% | 3.97% | 4.38% | 11.56% | 4.11% | 5.84% | 10.04% | 10.10% | 7.40% | 7.07% | 7.23% |
| Total Other Income/Expenses | -910.00M | -201.00M | -91.00M | -354.00M | -111.00M | -676.00M | -166.00M | -28.00M | -218.00M | -193.00M | 627.00M | -181.00M | -747.00M | -82.00M | -174.00M | -176.00M | -204.00M | -174.00M | -76.00M | -97.00M |
| Income Before Tax | 248.00M | 172.00M | -67.00M | -641.00M | 267.00M | 318.00M | 202.00M | 265.00M | 108.00M | 136.00M | 1.44B | 146.00M | -584.00M | 261.00M | 287.00M | 649.00M | 663.00M | 411.00M | 844.00M | 792.00M |
| Income Before Tax Ratio | 3.05% | 2.47% | -1.30% | -14.31% | 3.66% | 4.57% | 2.81% | 3.46% | 1.45% | 1.82% | 18.98% | 1.98% | -7.26% | 3.13% | 3.64% | 7.90% | 7.73% | 5.20% | 6.49% | 6.44% |
| Income Tax Expense | 78.00M | 33.00M | 22.00M | -31.00M | 55.00M | 124.00M | 2.00M | 69.00M | 37.00M | 87.00M | 117.00M | 40.00M | 105.00M | 67.00M | 123.00M | 22.00M | 99.00M | 92.00M | 142.00M | 240.00M |
| Net Income | 144.00M | 161.00M | -101.00M | -660.00M | -15.00M | 177.00M | 176.00M | 175.00M | 74.00M | 41.00M | 1.31B | 89.00M | -707.00M | 163.00M | 137.00M | 593.00M | 534.00M | 291.00M | 670.00M | 495.00M |
| Net Income Ratio | 1.77% | 2.31% | -1.95% | -14.73% | -0.21% | 2.55% | 2.45% | 2.29% | 0.99% | 0.55% | 17.28% | 1.21% | -8.78% | 1.95% | 1.74% | 7.22% | 6.22% | 3.68% | 5.15% | 4.03% |
| EPS | 0.97 | 1.15 | -0.75 | -5.11 | -0.12 | 1.36 | 1.36 | 1.36 | 0.58 | 0.32 | 10.22 | 0.70 | -5.56 | 1.29 | 1.08 | 1.08 | 4.62 | 2.13 | 4.88 | 3.65 |
| EPS Diluted | 1.01 | 1.14 | -0.75 | -5.11 | -0.12 | 1.35 | 1.34 | 1.34 | 0.57 | 0.32 | 10.09 | 0.69 | -5.56 | 1.27 | 1.07 | 1.07 | 4.62 | 2.09 | 4.74 | 3.44 |
| Weighted Avg Shares Out | 148.45M | 140.33M | 134.76M | 129.20M | 129.36M | 129.72M | 129.37M | 128.99M | 128.48M | 128.05M | 127.90M | 127.61M | 127.20M | 126.96M | 126.92M | 131.13M | 115.58M | 136.94M | 137.35M | 144.25M |
| Weighted Avg Shares Out (Dil) | 142.56M | 141.24M | 134.76M | 129.20M | 129.36M | 131.53M | 131.53M | 130.79M | 129.79M | 129.59M | 129.59M | 129.22M | 127.20M | 128.17M | 127.50M | 131.13M | 115.58M | 139.30M | 141.59M | 144.25M |
Media conglomerate Vivendi considers raising offer for Lagardere
Vivendi to launch offer for Lagardere at 24.10 euros per share
Vivendi: The Post-UMG Future Begins With Lagardere Acquisition
Lagardere share price jumps 20% after Vivendi increases stake
Lagardere shares surge 20% as Vivendi paves takeover path with stake buy
Vivendi paves way for Lagardere takeover with Amber stake buy
French prosecutor confirms raid of Lagardere's offices
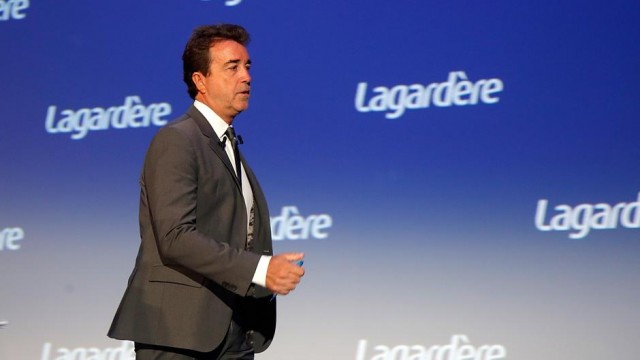
Lagardere CEO: There is no conflict with Arnault
Lagardere shares steady after billionaire Arnault restructures holding
France's Arnaud restructures his Lagardere holdings
Source: https://incomestatements.info
Category: Stock Reports
