See more : Vetnostrum Animal Health Co., Ltd. (6936.TWO) Income Statement Analysis – Financial Results
Complete financial analysis of AEye, Inc. (LIDR) income statement, including revenue, profit margins, EPS and key performance metrics. Get detailed insights into the financial performance of AEye, Inc., a leading company in the Auto – Parts industry within the Consumer Cyclical sector.
- Eminent Luggage Corporation (9950.TWO) Income Statement Analysis – Financial Results
- Jinneng Science&Techology Co.,Ltd (603113.SS) Income Statement Analysis – Financial Results
- 5th Planet Games A/S (5PG.OL) Income Statement Analysis – Financial Results
- Anzheng Fashion Group Co., Ltd. (603839.SS) Income Statement Analysis – Financial Results
- Lucara Diamond Corp. (LUC.TO) Income Statement Analysis – Financial Results
AEye, Inc. (LIDR)
About AEye, Inc.
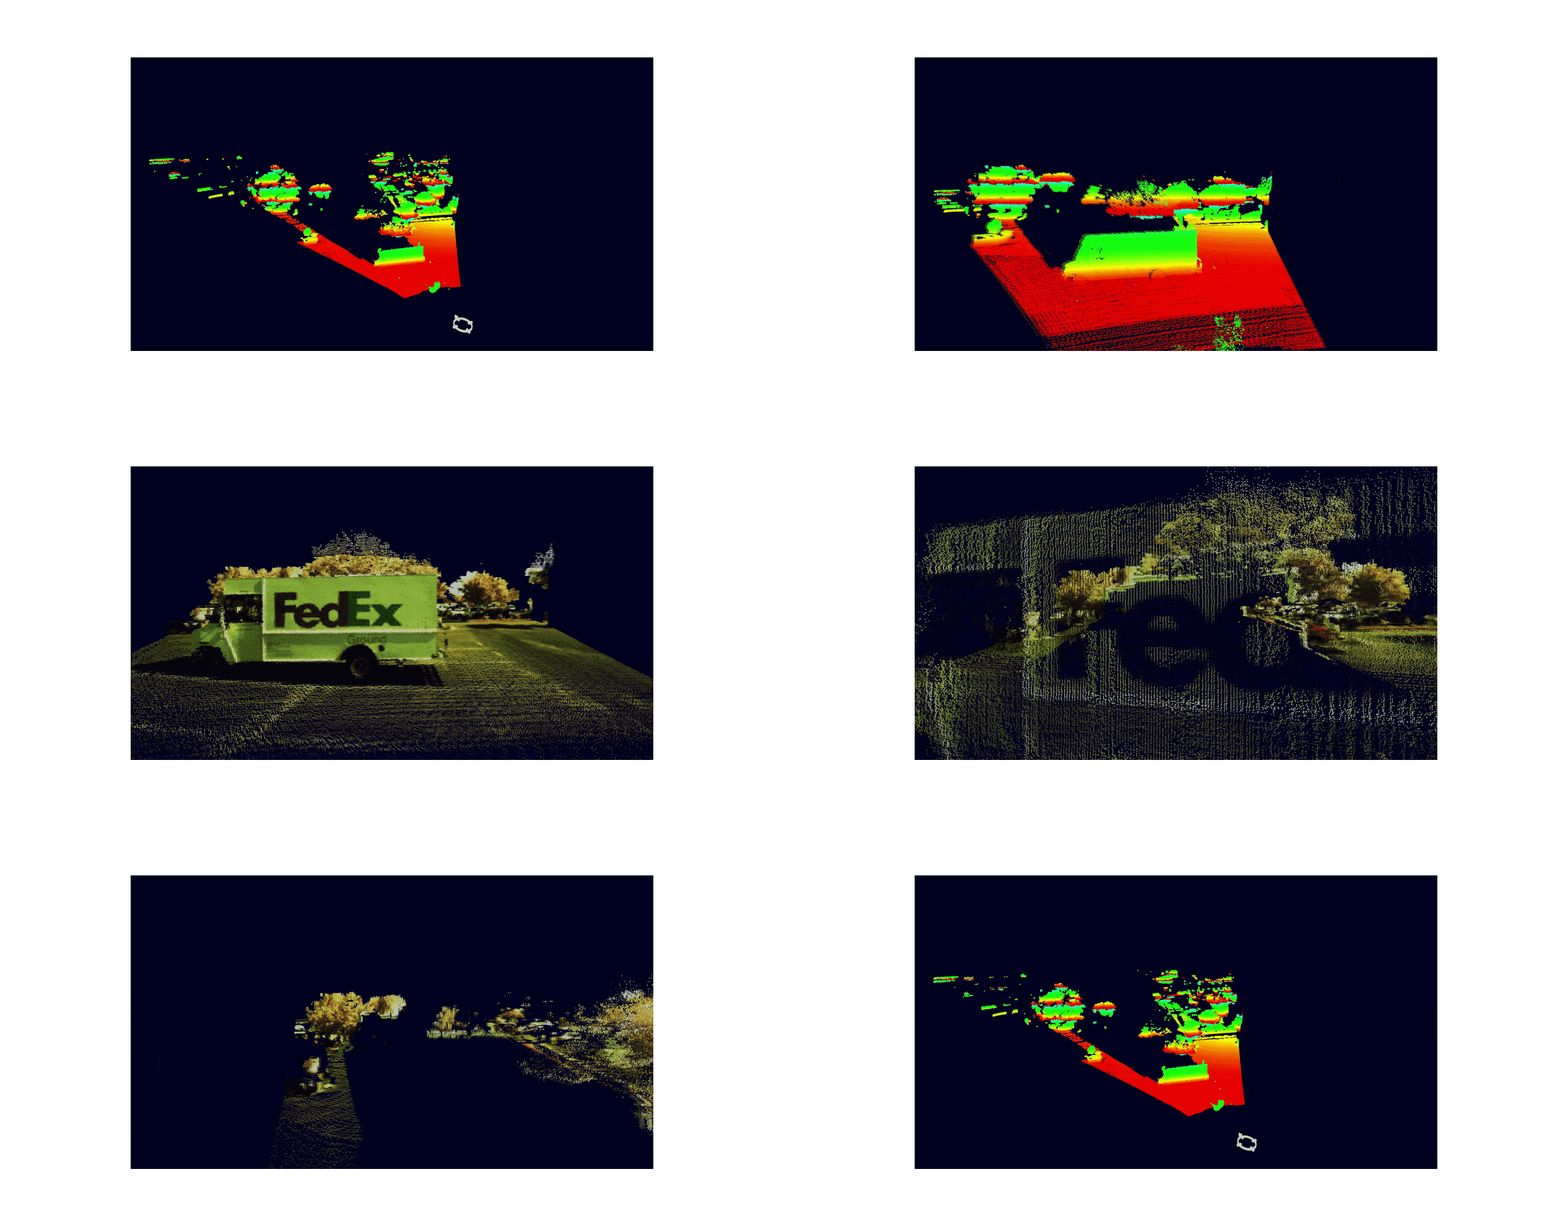
AEye, Inc. provides lidar systems for vehicle autonomy, advanced driver-assistance systems, and robotic vision applications in the United States, Europe, and Asia. It offers 4Sight A, a software-configurable lidar solution for automotive markets, including 4Sight at Design, Triggered 4Sight, or Responsive 4Sight software levels; and 4Sight M, a software-configurable lidar solution for the mobility and industrial markets, including 4Sight at Design, Triggered 4Sight, Responsive 4Sight, and Predictive 4Sight software levels. The company was formerly known as US LADAR, Inc. and changed its name to AEye, Inc. in March 2016. The company was founded in 2013 and is headquartered in Dublin, California.
| Metric | 2023 | 2022 | 2021 | 2020 | 2019 | 2018 |
|---|---|---|---|---|---|---|
| Revenue | 1.46M | 3.65M | 3.01M | 1.58M | 1.47M | 0.00 |
| Cost of Revenue | 15.32M | 8.73M | 3.64M | 808.00K | 253.00K | 0.00 |
| Gross Profit | -13.86M | -5.09M | -630.00K | 771.00K | 1.21M | 0.00 |
| Gross Profit Ratio | -946.38% | -139.43% | -20.95% | 48.83% | 82.74% | 0.00% |
| Research & Development | 26.17M | 37.64M | 26.54M | 17.13M | 18.66M | 0.00 |
| General & Administrative | 25.23M | 36.76M | 25.51M | 6.72M | 7.13M | 0.00 |
| Selling & Marketing | 12.53M | 19.32M | 10.55M | 3.41M | 4.24M | 0.00 |
| SG&A | 37.76M | 56.08M | 36.06M | 10.12M | 548.00 | 551.00 |
| Other Expenses | 0.00 | 0.00 | 0.00 | 0.00 | 0.00 | 0.00 |
| Operating Expenses | 73.92M | 93.72M | 62.61M | 27.25M | 548.00 | 551.00 |
| Cost & Expenses | 89.24M | 102.46M | 66.24M | 28.06M | 548.00 | 551.00 |
| Interest Income | 1.79M | 1.55M | 561.00K | 23.00K | 170.00K | 0.00 |
| Interest Expense | 34.00K | 1.38M | 4.86M | 1.41M | 0.00 | 0.00 |
| Depreciation & Amortization | 1.55M | 2.76M | 1.01M | 922.00K | 343.00K | 0.00 |
| EBITDA | -85.52M | -94.52M | -61.45M | -24.13M | -550.00 | -550.00 |
| EBITDA Ratio | -5,841.67% | -2,627.94% | -2,050.55% | -1,623.43% | -0.04% | 0.00% |
| Operating Income | -87.78M | -98.81M | -63.24M | -26.48M | -550.00 | -550.00 |
| Operating Income Ratio | -5,995.63% | -2,709.30% | -2,102.93% | -1,677.14% | -0.04% | 0.00% |
| Total Other Income/Expenses | 707.00K | 152.00K | -1.78M | -69.00K | 2.00 | -1.00 |
| Income Before Tax | -87.07M | -98.66M | -65.01M | -26.55M | -548.00 | -551.00 |
| Income Before Tax Ratio | -5,947.34% | -2,705.13% | -2,161.99% | -1,681.51% | -0.04% | 0.00% |
| Income Tax Expense | 57.00K | 58.00K | 4.86M | 1.41M | -343.00K | 0.00 |
| Net Income | -87.13M | -98.71M | -69.87M | -27.96M | -548.00 | -551.00 |
| Net Income Ratio | -5,951.23% | -2,706.72% | -2,323.51% | -1,770.49% | -0.04% | 0.00% |
| EPS | -14.95 | -18.82 | -13.51 | -30.64 | 0.00 | 0.00 |
| EPS Diluted | -14.95 | -18.82 | -13.51 | -30.64 | 0.00 | 0.00 |
| Weighted Avg Shares Out | 5.83M | 5.25M | 5.17M | 912.50K | 850.00K | 850.00K |
| Weighted Avg Shares Out (Dil) | 5.83M | 5.25M | 5.17M | 912.50K | 850.00K | 850.00K |

AEye Appoints Blair LaCorte as CEO; Luis Dussan Named President and CTO
Source: https://incomestatements.info
Category: Stock Reports
