See more : Raiffeisen Bank International AG (RAIFF) Income Statement Analysis – Financial Results
Complete financial analysis of Liontown Resources Limited (LINRF) income statement, including revenue, profit margins, EPS and key performance metrics. Get detailed insights into the financial performance of Liontown Resources Limited, a leading company in the Industrial Materials industry within the Basic Materials sector.
- Gannett Co., Inc. (GCI) Income Statement Analysis – Financial Results
- Aallon Group Oyj (AALLON.HE) Income Statement Analysis – Financial Results
- PYX Resources Limited (PYX.L) Income Statement Analysis – Financial Results
- ADS Maritime Holding Plc (ADCUF) Income Statement Analysis – Financial Results
- JALUX Inc. (2729.T) Income Statement Analysis – Financial Results
Liontown Resources Limited (LINRF)
About Liontown Resources Limited
Liontown Resources Limited engages in the exploration, evaluation, and development of mineral properties in Australia. The company explores for lithium, gold, vanadium, copper, and nickel deposits, as well as platinum group elements. Its flagship property is the Kathleen Valley lithium project located in Perth, Western Australia. The company was incorporated in 2006 and is based in West Perth, Australia.
| Metric | 2024 | 2023 | 2022 | 2021 | 2020 | 2019 | 2018 | 2017 | 2016 | 2015 | 2014 | 2013 | 2012 | 2011 | 2010 | 2009 | 2008 | 2007 |
|---|---|---|---|---|---|---|---|---|---|---|---|---|---|---|---|---|---|---|
| Revenue | 0.00 | 0.00 | 0.00 | 600.00K | 1.50M | 1.45K | 3.82M | 7.08K | 50.29K | 0.00 | 20.04K | 58.95K | 0.00 | 0.00 | 11.74K | 13.37K | 11.27K | 0.00 |
| Cost of Revenue | 0.00 | 322.00K | 226.00K | 0.00 | 0.00 | 0.00 | 3.81M | 0.00 | 10.40K | 0.00 | 0.00 | 0.00 | 0.00 | 0.00 | 0.00 | 0.00 | 0.00 | 0.00 |
| Gross Profit | 0.00 | -322.00K | -226.00K | 600.00K | 1.50M | 1.45K | 1.55K | 7.08K | 39.90K | 0.00 | 20.04K | 58.95K | 0.00 | 0.00 | 11.74K | 13.37K | 11.27K | 0.00 |
| Gross Profit Ratio | 0.00% | 0.00% | 0.00% | 100.00% | 100.00% | 100.00% | 0.04% | 100.00% | 79.32% | 0.00% | 100.00% | 100.00% | 0.00% | 0.00% | 100.00% | 100.00% | 100.00% | 0.00% |
| Research & Development | 0.00 | 0.00 | 0.00 | 0.00 | 0.00 | 0.00 | 53.36K | 46.07K | 306.28K | 30.17K | 0.00 | 0.00 | 0.00 | 0.00 | 0.00 | 0.00 | 0.00 | 0.00 |
| General & Administrative | 37.00M | 22.15M | 10.60M | 4.09M | 2.90M | 2.13M | 1.01M | 568.37K | 360.19K | 323.65K | 393.14K | 595.25K | 636.07K | 997.91K | 596.60K | 1.07M | 1.46M | 694.53K |
| Selling & Marketing | 4.33M | 11.67M | 2.02M | 68.22K | 166.20K | 384.49K | 144.79K | 46.07K | 306.28K | 30.17K | 0.00 | 0.00 | 0.00 | 0.00 | 0.00 | 0.00 | 40.97K | 8.94K |
| SG&A | 60.71M | 33.82M | 10.60M | 4.15M | 3.07M | 2.51M | 1.16M | 568.37K | 360.19K | 323.65K | 393.14K | 595.25K | 636.07K | 997.91K | 596.60K | 1.07M | 1.50M | 703.47K |
| Other Expenses | -225.00K | 406.00K | 91.59M | 600.00K | 1.50M | -137.56K | 3.90M | 7.08K | 37.88K | 487.53K | 20.04K | 0.00 | 0.00 | 0.00 | 1.57M | 0.00 | -69.47K | -1.89K |
| Operating Expenses | 60.48M | 33.82M | 51.53M | 11.68M | 14.41M | 12.60M | 4.52M | 3.30M | 5.49M | 1.34M | 1.40M | 3.06M | 1.28M | 1.31M | 813.21K | 6.66M | 2.19M | 1.00M |
| Cost & Expenses | 60.48M | 34.14M | 51.53M | 11.68M | 14.41M | 12.60M | 4.52M | 3.30M | 5.49M | 1.34M | 1.40M | 3.06M | 1.28M | 1.31M | 813.21K | 6.66M | 2.19M | 1.00M |
| Interest Income | 0.00 | 11.56M | 1.30M | 27.19K | 107.84K | 45.55K | 28.42K | 9.79K | 7.36K | 10.69K | 7.00K | 58.95K | 62.80K | 117.48K | 70.75K | 44.10K | 132.22K | 133.18K |
| Interest Expense | 0.00 | 231.00K | 18.00K | 8.30K | 8.59K | 0.00 | 0.00 | 0.00 | 10.14K | 0.00 | 0.00 | 0.00 | 0.00 | 0.00 | 0.00 | 14.40K | 12.28K | 5.39K |
| Depreciation & Amortization | 1.39M | 322.00K | 226.00K | 82.63K | 60.86K | 12.22K | 11.78K | 12.53K | 10.40K | 8.98K | 10.48K | 16.95K | 21.26K | 32.56K | 46.44K | 78.60K | 105.88K | 18.20K |
| EBITDA | -59.31M | -33.82M | -52.12M | -11.64M | -12.74M | -12.55M | -4.50M | -3.28M | -2.08M | -1.34M | -1.37M | -3.04M | -1.26M | -1.27M | -643.19K | -6.52M | -2.01M | -852.08K |
| EBITDA Ratio | 0.00% | 0.00% | 0.00% | -1,827.81% | -849.31% | -865,420.34% | -112.77% | -46,529.38% | -10,816.39% | 0.00% | -6,876.00% | -5,165.59% | 0.00% | 0.00% | -6,430.19% | -48,793.73% | -17,853.41% | 0.00% |
| Operating Income | -60.48M | -34.14M | 41.37M | -11.05M | -12.81M | -12.56M | -4.31M | -3.30M | -5.44M | -1.34M | -1.39M | -3.06M | -1.28M | -1.31M | -801.47K | -6.60M | -2.12M | -870.29K |
| Operating Income Ratio | 0.00% | 0.00% | 0.00% | -1,841.58% | -853.37% | -866,247.86% | -113.03% | -46,636.13% | -10,824.65% | 0.00% | -6,928.32% | -5,194.34% | 0.00% | 0.00% | -6,825.65% | -49,381.50% | -18,792.68% | 0.00% |
| Total Other Income/Expenses | -4.43M | 11.32M | -18.00K | 19.00K | 99.25K | -163.12K | 3.72M | 8.82K | -5.05K | -272.10K | 1.19K | 0.00 | 62.80K | 117.48K | 1.53M | -10.97K | -8.19M | -6.92K |
| Income Before Tax | -64.91M | -22.41M | 41.35M | -11.06M | -12.83M | -12.72M | -793.18K | -3.28M | -5.45M | -846.29K | -1.39M | -3.00M | -1.22M | -1.19M | 842.47K | -6.61M | -10.31M | -877.20K |
| Income Before Tax Ratio | 0.00% | 0.00% | 0.00% | -1,843.18% | -855.23% | -877,497.59% | -20.79% | -46,397.77% | -10,844.82% | 0.00% | -6,922.37% | -5,094.34% | 0.00% | 0.00% | 7,174.87% | -49,463.50% | -91,452.77% | 0.00% |
| Income Tax Expense | 6.00K | -192.00K | 492.00K | -492.00K | 1.51M | -9.99K | 59.38K | -9.79K | 48.02K | -10.69K | 5.92K | 0.00 | 0.00 | 0.00 | 460.76K | 14.40K | -57.19K | 3.50K |
| Net Income | -64.92M | -22.21M | 40.86M | -10.57M | -12.83M | -12.72M | -859.07K | -3.28M | -5.45M | -846.29K | -1.39M | -3.00M | -1.22M | -1.19M | 310.97K | -6.61M | -10.31M | -877.20K |
| Net Income Ratio | 0.00% | 0.00% | 0.00% | -1,761.18% | -855.23% | -877,497.59% | -22.52% | -46,397.77% | -10,844.82% | 0.00% | -6,922.37% | -5,094.34% | 0.00% | 0.00% | 2,648.31% | -49,463.50% | -91,452.77% | 0.00% |
| EPS | -0.03 | -0.01 | 0.02 | -0.01 | -0.01 | -0.01 | 0.00 | 0.00 | -0.01 | 0.00 | 0.00 | -0.01 | 0.00 | 0.00 | 0.00 | -0.05 | -0.08 | -0.01 |
| EPS Diluted | -0.03 | -0.01 | 0.02 | -0.01 | -0.01 | -0.01 | 0.00 | 0.00 | -0.01 | 0.00 | 0.00 | -0.01 | 0.00 | 0.00 | 0.00 | -0.05 | -0.08 | -0.01 |
| Weighted Avg Shares Out | 2.32B | 2.20B | 2.06B | 1.78B | 1.68B | 1.24B | 1.00B | 871.25M | 644.08M | 484.20M | 426.59M | 348.71M | 269.73M | 250.11M | 236.90M | 129.54M | 130.15M | 63.67M |
| Weighted Avg Shares Out (Dil) | 2.35B | 2.20B | 2.08B | 1.78B | 1.68B | 1.25B | 1.00B | 871.25M | 644.08M | 484.20M | 426.59M | 348.71M | 269.73M | 250.11M | 236.90M | 129.54M | 130.15M | 63.67M |

Lithium behemoth Albemarle makes revised bid to acquire Liontown valued at US$4.3 billion
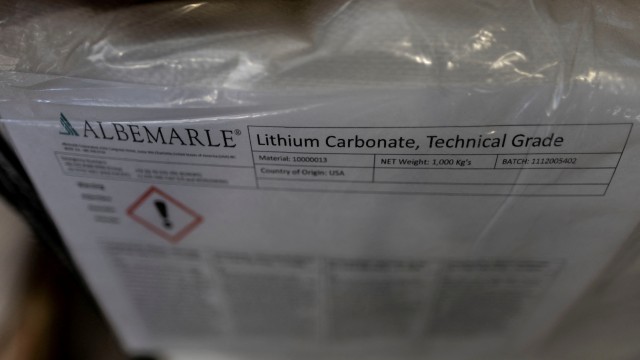
Albemarle aims to close buyout of lithium developer Liontown by mid-2024

Albemarle Raises Bid for Australia's Liontown Resources to $4.25 Billion
Albemarle nears $4.3 billion deal to buy Australian lithium miner Liontown: report

Albemarle confirms non-binding agreement to acquire Liontown

Lithium developer Liontown backs Albemarle's $4.3 billion bid
Sumitomo, Australia's Liontown to study lithium hydroxide production in Japan
Lithium price has troughed with potential wave of M&A activity ahead, broker says
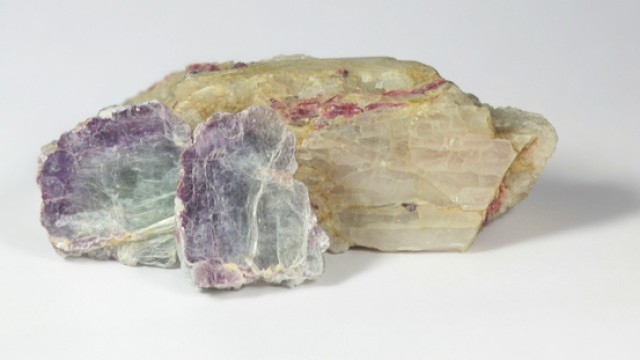
Abermarle's A$5.5B bid for Australian lithium developer Liontown gets rebuffed, target's shares soar

Liontown Resources: Kathleen Valley Progressing Nicely
Source: https://incomestatements.info
Category: Stock Reports
