See more : Contrel Technology Co., Ltd. (8064.TWO) Income Statement Analysis – Financial Results
Complete financial analysis of Luckin Coffee Inc. (LKNCY) income statement, including revenue, profit margins, EPS and key performance metrics. Get detailed insights into the financial performance of Luckin Coffee Inc., a leading company in the Restaurants industry within the Consumer Cyclical sector.
- Royalty Management Holding Corporation (RMCOW) Income Statement Analysis – Financial Results
- Priority Income Fund, Inc. (PRIF-PH) Income Statement Analysis – Financial Results
- Comrade Appliances Limited (COMRADE.BO) Income Statement Analysis – Financial Results
- Noble Rock Acquisition Corporation (NRACU) Income Statement Analysis – Financial Results
- TuanChe Limited (TC) Income Statement Analysis – Financial Results
Luckin Coffee Inc. (LKNCY)
About Luckin Coffee Inc.
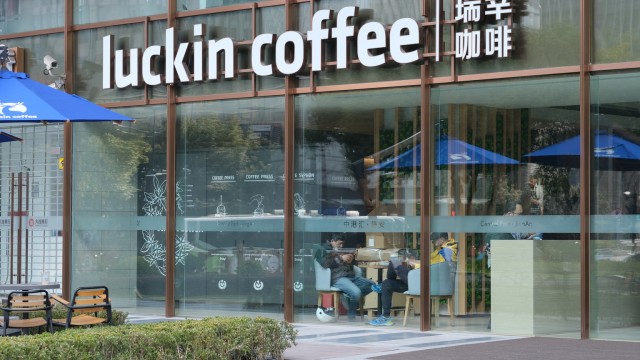
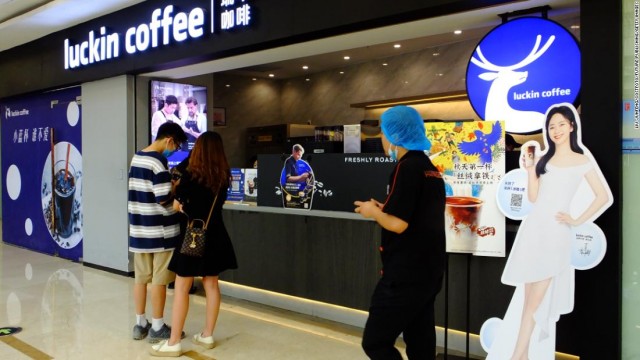
Luckin Coffee Inc. engages in the retail services of freshly brewed coffee and non-coffee drinks in the People's Republic of China. It also offers hot and iced freshly brewed coffee, such as Americano, Latte, Cappuccino, Macchiato, Flat White, and Mocha, as well as specialty coffee based on market and seasonal trends; coconut milk latte products; tea drinks; pre-made beverages; and pre-made food items, such as pastries, sandwiches, and snacks. In addition, the company offers cups, tote bags, and other merchandises. It operates pick-up stores, relax stores, and delivery kitchens under the Luckin brand, as well as Luckin mobile app, Weixin mini-program, and other third-party platforms for third-party payment channels. Further, the company provides technical and consultation services; and manufactures materials for products. As of December 31, 2021, it operated 4,397 self-operated stores; 1,627 partnership stores; and 1,102 Luckin Coffee EXPRESS machines. Luckin Coffee Inc. was incorporated in 2017 and is headquartered in Xiamen, the People's Republic of China.
| Metric | 2023 | 2022 | 2021 | 2020 | 2019 | 2018 | 2017 |
|---|---|---|---|---|---|---|---|
| Revenue | 24.90B | 13.29B | 7.97B | 4.03B | 3.02B | 840.70M | 500.00K |
| Cost of Revenue | 10.89B | 8.01B | 5.24B | 3.72B | 3.22B | 1.11B | 1.58M |
| Gross Profit | 14.01B | 5.28B | 2.73B | 311.42M | -195.52M | -267.77M | -1.08M |
| Gross Profit Ratio | 56.26% | 39.75% | 34.27% | 7.72% | -6.46% | -31.85% | -215.60% |
| Research & Development | 338.82M | 301.39M | 251.69M | 265.54M | 219.05M | 77.96M | 10.16M |
| General & Administrative | 648.95M | 1.46B | 1.27B | 981.65M | 1.07B | 379.74M | 44.01M |
| Selling & Marketing | 1.29B | 1.94B | 1.16B | 876.92M | 1.25B | 746.02M | 50.93M |
| SG&A | 1.94B | 3.40B | 2.43B | 1.86B | 2.32B | 1.13B | 109.50M |
| Other Expenses | 8.71B | 126.56M | 481.74M | 493.40M | 483.51M | -7.78M | 0.00 |
| Operating Expenses | 10.99B | 3.83B | 2.91B | 2.35B | 2.81B | 1.33B | 111.69M |
| Cost & Expenses | 21.88B | 11.84B | 8.14B | 6.07B | 6.03B | 2.44B | 113.26M |
| Interest Income | 108.68M | 84.92M | 102.25M | 135.71M | 79.41M | 8.92M | 22.00K |
| Interest Expense | 0.00 | 23.48M | 35.49M | 116.47M | 31.63M | 16.12M | 0.00 |
| Depreciation & Amortization | 2.00B | 1.25B | 1.14B | 483.42M | 411.88M | 106.69M | 1.83M |
| EBITDA | 5.11B | 2.40B | 1.69B | -5.55B | -2.72B | -1.50B | -110.58M |
| EBITDA Ratio | 20.52% | 14.98% | 4.68% | -36.69% | -83.24% | -177.26% | -22,116.00% |
| Operating Income | 3.03B | 1.60B | -92.39M | -2.04B | -3.21B | -1.60B | -112.41M |
| Operating Income Ratio | 12.15% | 12.03% | -1.16% | -50.59% | -106.19% | -190.08% | -22,482.80% |
| Total Other Income/Expenses | 81.74M | -29.43M | 1.05B | -4.20B | 53.00M | -21.15M | -328.00K |
| Income Before Tax | 3.11B | 1.13B | 622.52M | -6.24B | -3.16B | -1.62B | -112.74M |
| Income Before Tax Ratio | 12.48% | 8.48% | 7.82% | -154.73% | -104.44% | -192.60% | -22,548.40% |
| Income Tax Expense | 259.43M | 638.50M | -63.86M | -637.80M | 1.39M | 6.16M | 0.00 |
| Net Income | 2.85B | 488.25M | 578.55M | -5.60B | -3.16B | -1.62B | -112.74M |
| Net Income Ratio | 11.44% | 3.67% | 7.26% | -138.91% | -104.48% | -192.60% | -22,548.40% |
| EPS | 8.96 | 1.60 | 2.32 | -22.17 | -15.73 | -8.63 | -2.41 |
| EPS Diluted | 9.00 | 1.52 | 2.16 | -22.17 | -15.71 | -8.63 | -2.41 |
| Weighted Avg Shares Out | 317.85M | 309.13M | 256.41M | 252.74M | 200.90M | 187.62M | 46.88M |
| Weighted Avg Shares Out (Dil) | 316.57M | 314.53M | 266.98M | 252.74M | 201.15M | 187.62M | 46.88M |

7 Stocks on the Cusp of a Major Move Higher

China's Luckin plans store expansion, remains committed to U.S. market

Luckin Coffee Inc. (LKNCY) CEO Jinyi Guo on Q2 2022 Results - Earnings Call Transcript

10 Stocks to Sell Before They Die

Luckin Coffee: Q2 2022 New Store Opening Updates

3 Reasons to Buy Luckin Coffee Stock

Luckin Coffee is back and bigger than Starbucks in China

Luckin Coffee Inc. ADR (LKNCY) CEO Jinyi Guo on Q1 2022 Results - Earnings Call Transcript

Luckin Coffee Stock Treks Higher on 90% Revenue Growth

Try Your Luck in My 3-Stock Derby
Source: https://incomestatements.info
Category: Stock Reports
