See more : Hangcha Group Co., Ltd (603298.SS) Income Statement Analysis – Financial Results
Complete financial analysis of Landmark Infrastructure Partners LP (LMRKP) income statement, including revenue, profit margins, EPS and key performance metrics. Get detailed insights into the financial performance of Landmark Infrastructure Partners LP, a leading company in the Real Estate – Services industry within the Real Estate sector.
- HK Asia Holdings Limited (1723.HK) Income Statement Analysis – Financial Results
- Singulus Technologies AG (0RH3.L) Income Statement Analysis – Financial Results
- Welspun Living Limited (WELSPUNLIV.BO) Income Statement Analysis – Financial Results
- Gujarat State Fertilizers & Chemicals Limited (GSFC.BO) Income Statement Analysis – Financial Results
- Henderson Investment Limited (0097.HK) Income Statement Analysis – Financial Results
Landmark Infrastructure Partners LP (LMRKP)
| Metric | 2020 | 2019 | 2018 | 2017 | 2016 | 2015 | 2014 | 2013 | 2012 |
|---|---|---|---|---|---|---|---|---|---|
| Revenue | 58.84M | 59.34M | 64.77M | 52.63M | 41.17M | 33.60M | 14.20M | 12.63M | 6.78M |
| Cost of Revenue | 1.88M | 1.98M | 1.15M | 394.00K | 303.00K | 516.00K | 24.72K | 6.45K | 26.27K |
| Gross Profit | 56.96M | 57.36M | 63.62M | 52.23M | 40.87M | 33.08M | 14.17M | 12.62M | 6.76M |
| Gross Profit Ratio | 96.81% | 96.66% | 98.23% | 99.25% | 99.26% | 98.46% | 99.83% | 99.95% | 99.61% |
| Research & Development | 0.00 | 0.00 | 0.00 | 0.00 | 0.00 | 0.00 | 0.00 | 0.00 | 0.00 |
| General & Administrative | 4.74M | 5.57M | 4.73M | 5.29M | 3.76M | 2.92M | 1.18M | 1.09M | 400.38K |
| Selling & Marketing | 0.00 | 0.00 | 0.00 | 0.00 | 0.00 | 0.00 | 0.00 | 0.00 | 0.00 |
| SG&A | 4.74M | 5.57M | 4.73M | 5.29M | 3.76M | 2.92M | 1.18M | 1.09M | 400.38K |
| Other Expenses | 16.47M | 14.24M | 16.15M | 13.54M | 11.39M | 7.15M | 3.50M | 2.31M | 1.43M |
| Operating Expenses | 21.21M | 19.80M | 20.88M | 18.82M | 15.14M | 10.07M | 4.68M | 3.41M | 1.83M |
| Cost & Expenses | 23.09M | 25.24M | 27.03M | 21.35M | 21.13M | 21.88M | 4.70M | 3.41M | 1.86M |
| Interest Income | 450.00K | 832.00K | 1.64M | 1.59M | 1.23M | 786.14K | 709.03K | 742.19K | 356.35K |
| Interest Expense | 17.27M | 18.17M | 24.27M | 18.40M | 13.92M | 8.40M | 4.98M | 3.84M | 1.48M |
| Depreciation & Amortization | 17.00M | 14.24M | 16.15M | 13.54M | 11.19M | 6.92M | 3.50M | 2.31M | 1.43M |
| EBITDA | 62.93M | 57.76M | 156.45M | 48.05M | 35.04M | 16.52M | 5.78M | 11.92M | 4.43M |
| EBITDA Ratio | 106.95% | 97.34% | 241.56% | 91.30% | 85.10% | 49.18% | 40.73% | 94.36% | 65.29% |
| Operating Income | 35.75M | 34.10M | 37.73M | 31.27M | 20.04M | 11.72M | 9.50M | 9.22M | 4.92M |
| Operating Income Ratio | 60.76% | 57.47% | 58.26% | 59.43% | 48.67% | 34.88% | 66.89% | 72.98% | 72.56% |
| Total Other Income/Expenses | -24.40M | -8.72M | 78.32M | -15.14M | -10.12M | -10.51M | -8.95M | -3.45M | -3.40M |
| Income Before Tax | 11.35M | 25.39M | 116.05M | 16.13M | 9.92M | 1.21M | 545.42K | 5.76M | 1.52M |
| Income Before Tax Ratio | 19.29% | 42.79% | 179.18% | 30.65% | 24.10% | 3.59% | 3.84% | 45.64% | 22.37% |
| Income Tax Expense | -430.00K | 3.78M | 227.00K | -3.15M | 3.81M | -2.11M | -3.97M | 387.00K | -1.93M |
| Net Income | 29.09M | 21.58M | 115.79M | 19.26M | 9.92M | 1.21M | -2.70M | 5.76M | 1.52M |
| Net Income Ratio | 49.43% | 36.36% | 178.79% | 36.59% | 24.10% | 3.59% | -19.00% | 45.64% | 22.37% |
| EPS | 1.14 | 0.85 | 4.23 | 0.74 | 0.49 | 0.09 | -0.34 | 0.74 | 0.19 |
| EPS Diluted | 1.14 | 0.85 | 4.23 | 0.74 | 0.49 | 0.09 | -0.34 | 0.74 | 0.19 |
| Weighted Avg Shares Out | 25.47M | 25.34M | 27.35M | 25.97M | 20.26M | 13.83M | 7.84M | 7.84M | 7.84M |
| Weighted Avg Shares Out (Dil) | 25.47M | 25.34M | 27.35M | 25.97M | 20.26M | 13.83M | 7.84M | 7.84M | 7.84M |

Oasis In The Desert Of Quality Yields: Landmark Preferred Shares Offer Consistent 8% Income From Cell Towers, Billboards And Renewable Power

Understanding Landmark Infrastructure's Ex-Dividend Date
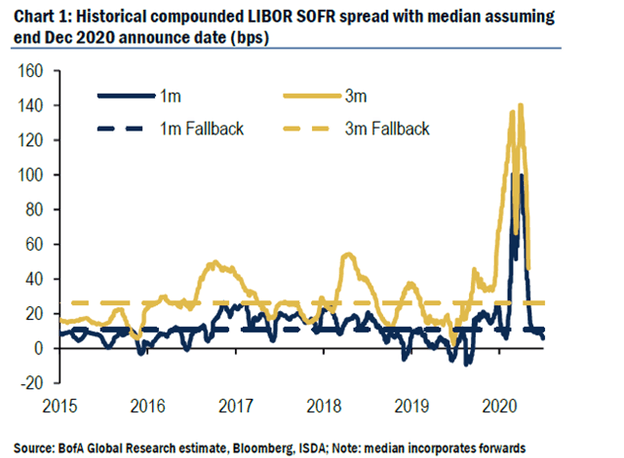
Transition From LIBOR: What You Need To Know
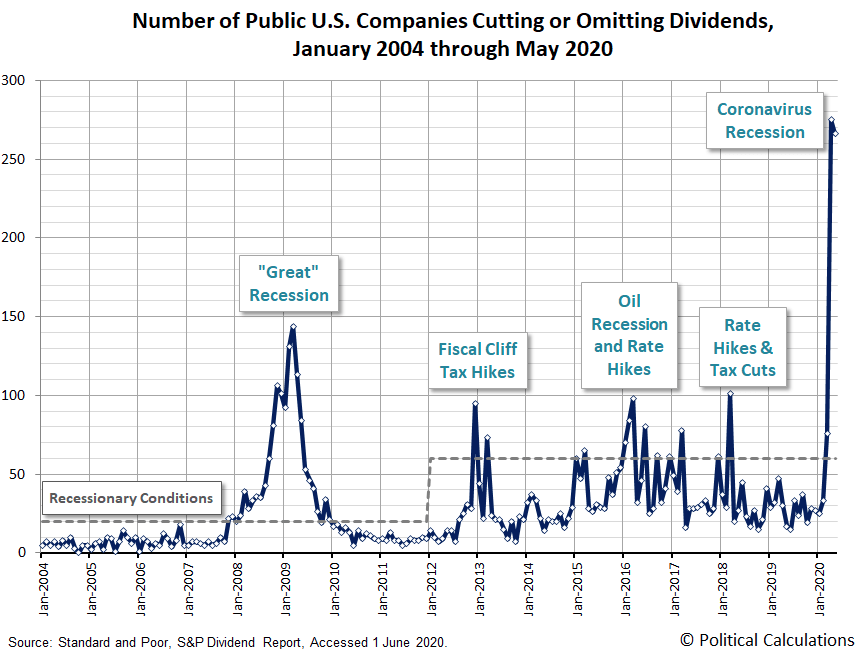
Landmark: 8% Yields With 3 Times Coverage
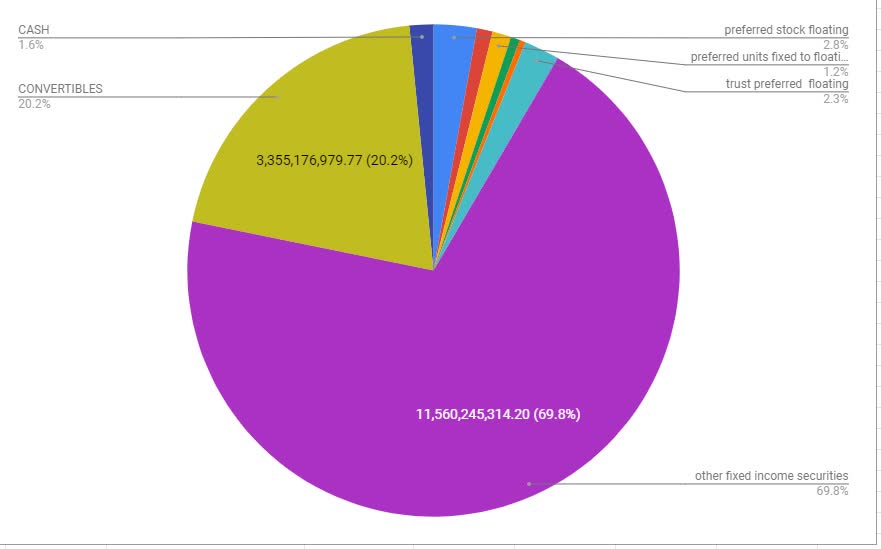
Not So Common Fixed Income Preview
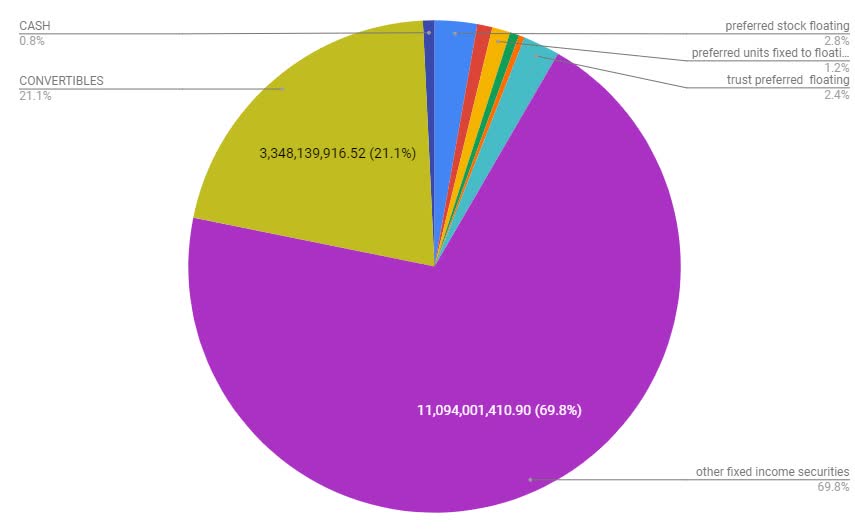
Not So Common Fixed Income Preview

Cell Tower REITs: Fireworks Abound As Competition Heats Up
Not So Common Fixed-Income Preview

Cell Tower REITs: Stay-At-Home Winners
Source: https://incomestatements.info
Category: Stock Reports
