See more : Jiangsu Holly Corporation (600128.SS) Income Statement Analysis – Financial Results
Complete financial analysis of The Lovesac Company (LOVE) income statement, including revenue, profit margins, EPS and key performance metrics. Get detailed insights into the financial performance of The Lovesac Company, a leading company in the Furnishings, Fixtures & Appliances industry within the Consumer Cyclical sector.
- 4D Molecular Therapeutics, Inc. (FDMT) Income Statement Analysis – Financial Results
- Regency Centers Corporation (REGCO) Income Statement Analysis – Financial Results
- OC Oerlikon Corporation AG (0QO3.L) Income Statement Analysis – Financial Results
- SiS International Holdings Limited (0529.HK) Income Statement Analysis – Financial Results
- Solar Integrated Roofing Corporation (SIRC) Income Statement Analysis – Financial Results
The Lovesac Company (LOVE)
Industry: Furnishings, Fixtures & Appliances
Sector: Consumer Cyclical
Website: https://www.lovesac.com
About The Lovesac Company
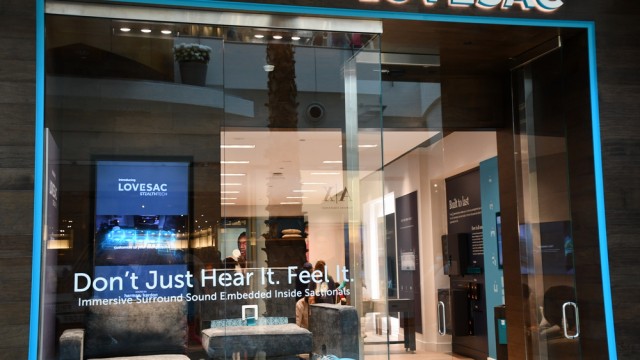
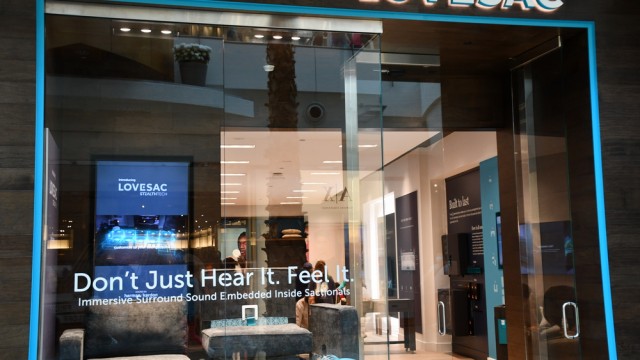
The Lovesac Company designs, manufactures, and sells furniture. It offers sactionals, such as seats and sides; sacs, including foam beanbag chairs; and accessories comprising drink holders, footsac blankets, decorative pillows, fitted seat tables, and ottomans. As of January 30, 2022, the company operated 146 showrooms. It markets its products primarily through lovesac.com website, as well as showrooms at top tier malls, lifestyle centers, kiosks, mobile concierges, and street locations in 39 states of the United States; and in store pop-up- shops and shop-in-shops. The Lovesac Company was founded in 1995 and is headquartered in Stamford, Connecticut.
| Metric | 2024 | 2023 | 2022 | 2021 | 2020 | 2019 | 2018 | 2017 | 2016 |
|---|---|---|---|---|---|---|---|---|---|
| Revenue | 700.27M | 651.55M | 498.24M | 320.74M | 233.38M | 165.88M | 101.81M | 76.34M | 74.15M |
| Cost of Revenue | 311.83M | 305.72M | 224.89M | 145.97M | 116.69M | 75.00M | 44.59M | 34.65M | 33.64M |
| Gross Profit | 388.44M | 345.83M | 273.35M | 174.77M | 116.69M | 90.88M | 57.22M | 41.70M | 40.51M |
| Gross Profit Ratio | 55.47% | 53.08% | 54.86% | 54.49% | 50.00% | 54.79% | 56.20% | 54.62% | 54.64% |
| Research & Development | 0.00 | 0.00 | 0.00 | 0.00 | 0.00 | 0.00 | 0.00 | 0.00 | 0.00 |
| General & Administrative | 264.31M | 216.10M | 161.97M | 111.35M | 98.15M | 76.43M | 62.25M | 47.87M | 47.17M |
| Selling & Marketing | 94.05M | 79.86M | 65.08M | 41.92M | 29.19M | 18.36M | 15.41M | 2.24M | 2.93M |
| SG&A | 358.36M | 295.97M | 227.05M | 153.28M | 127.34M | 94.79M | 62.25M | 47.87M | 47.17M |
| Other Expenses | 0.00 | 10.84M | 7.86M | 6.61M | 5.16M | 3.13M | 0.00 | 0.00 | -86.34K |
| Operating Expenses | 358.36M | 306.81M | 234.90M | 159.89M | 132.50M | 97.92M | 62.25M | 47.87M | 47.17M |
| Cost & Expenses | 670.19M | 612.53M | 459.80M | 305.86M | 249.19M | 172.92M | 106.85M | 82.51M | 80.81M |
| Interest Income | 1.75M | 117.00K | 179.00K | 67.00K | 646.84K | 355.36K | 0.00 | 0.00 | 0.00 |
| Interest Expense | 0.00 | 117.00K | 179.00K | 67.00K | 0.00 | 355.36K | 437.97K | 565.56K | 1.69M |
| Depreciation & Amortization | 12.60M | 10.84M | 7.86M | 6.61M | 5.16M | 3.13M | 2.21M | 2.11M | 2.38M |
| EBITDA | 42.68M | 47.81M | 46.30M | 21.49M | -10.00M | -3.55M | -2.82M | -4.06M | -4.92M |
| EBITDA Ratio | 6.09% | 7.65% | 9.29% | 6.70% | -4.56% | -2.36% | -2.77% | -5.32% | -5.89% |
| Operating Income | 30.08M | 39.02M | 38.44M | 14.88M | -15.81M | -7.04M | -5.04M | -6.17M | -6.66M |
| Operating Income Ratio | 4.29% | 5.99% | 7.72% | 4.64% | -6.77% | -4.25% | -4.95% | -8.08% | -8.99% |
| Total Other Income/Expenses | 1.75M | -117.00K | -179.00K | -67.22K | 647.00K | 355.36K | -437.97K | -565.56K | -2.33M |
| Income Before Tax | 31.82M | 38.90M | 38.26M | 14.81M | -15.16M | -6.69M | -5.48M | -6.74M | -8.99M |
| Income Before Tax Ratio | 4.54% | 5.97% | 7.68% | 4.62% | -6.50% | -4.03% | -5.38% | -8.82% | -12.13% |
| Income Tax Expense | 7.96M | 10.66M | -7.64M | 85.69K | 43.31K | 16.41K | 26.00K | 138.00K | 1.60M |
| Net Income | 23.86M | 26.49M | 47.49M | 14.73M | -15.21M | -6.70M | -5.50M | -6.87M | -8.99M |
| Net Income Ratio | 3.41% | 4.07% | 9.53% | 4.59% | -6.52% | -4.04% | -5.40% | -9.00% | -12.13% |
| EPS | 1.55 | 1.74 | 3.14 | 1.01 | -1.07 | -0.64 | -0.43 | -0.53 | -0.70 |
| EPS Diluted | 1.45 | 1.66 | 2.96 | 0.96 | -1.07 | -0.64 | -0.43 | -0.53 | -0.70 |
| Weighted Avg Shares Out | 15.43M | 15.20M | 15.11M | 14.61M | 14.26M | 10.54M | 12.93M | 12.93M | 12.93M |
| Weighted Avg Shares Out (Dil) | 16.46M | 15.96M | 16.06M | 15.33M | 14.26M | 10.54M | 12.93M | 12.93M | 12.93M |

The Lovesac Company (LOVE) Q4 2024 Earnings Call Transcript

Is Lovesac (LOVE) Stock Undervalued Right Now?

Lovesac (LOVE) Shows Fast-paced Momentum But Is Still a Bargain Stock

Lovesac stock price: buy the dip or sell the rip?

Lovesac stock price: buy the dip or sell the rip?

The Lovesac Company Reports Fourth Quarter and Fiscal 2024 Financial Results

Here's What to Expect From Lovesac's (LOVE) Q4 Earnings

Countdown to Lovesac (LOVE) Q4 Earnings: Wall Street Forecasts for Key Metrics

7 Consumer Discretionary Stocks Short Sellers are Betting Will Fall from Grace

3 Sorry Retail Stocks to Sell in March While You Still Can
Source: https://incomestatements.info
Category: Stock Reports
