See more : FiberCore, Inc. (FBCE) Income Statement Analysis – Financial Results
Complete financial analysis of LQR House Inc. (LQR) income statement, including revenue, profit margins, EPS and key performance metrics. Get detailed insights into the financial performance of LQR House Inc., a leading company in the Beverages – Wineries & Distilleries industry within the Consumer Defensive sector.
- XMReality AB (publ) (XMR.ST) Income Statement Analysis – Financial Results
- M8 Sustainable Limited (M8S.AX) Income Statement Analysis – Financial Results
- Firma Holdings Corp. (FRMA) Income Statement Analysis – Financial Results
- Toyota Motor Corp (TOM.HM) Income Statement Analysis – Financial Results
- Rodium Realty Limited (RODIUM.BO) Income Statement Analysis – Financial Results
LQR House Inc. (LQR)
Industry: Beverages - Wineries & Distilleries
Sector: Consumer Defensive
Website: https://www.lqrhouse.com
About LQR House Inc.
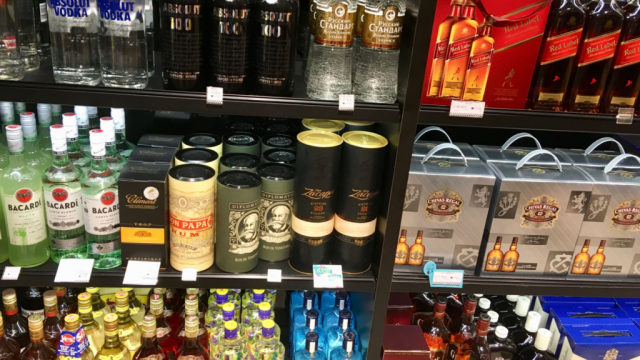
LQR House Inc. provides digital marketing and brand development services for the alcoholic beverage business in the United States. Its primary business includes the development of limited batch spirit brands and marketing internal and external brands through an exclusive agreement with an e-commerce portal. The company serves individual consumers, wholesalers, and third-party alcohol brands. LQR House Inc. was incorporated in 2021 and is based in Miami Beach, Florida.
| Metric | 2023 | 2022 | 2021 |
|---|---|---|---|
| Revenue | 1.12M | 601.13K | 315.29K |
| Cost of Revenue | 915.60K | 803.14K | 677.45K |
| Gross Profit | 205.02K | -202.01K | -362.16K |
| Gross Profit Ratio | 18.30% | -33.61% | -114.86% |
| Research & Development | 0.00 | 0.00 | 0.00 |
| General & Administrative | 11.43M | 985.01K | 1.14M |
| Selling & Marketing | 2.48M | 655.15K | 464.01K |
| SG&A | 13.91M | 1.64M | 1.60M |
| Other Expenses | 1.88M | 0.00 | 0.00 |
| Operating Expenses | 15.78M | 1.64M | 1.60M |
| Cost & Expenses | 16.70M | 2.44M | 2.28M |
| Interest Income | 0.00 | 0.00 | 0.00 |
| Interest Expense | 171.00K | 0.00 | 0.00 |
| Depreciation & Amortization | 208.33K | 250.00K | 166.67K |
| EBITDA | -15.37M | -1.59M | -1.80M |
| EBITDA Ratio | -1,371.42% | -264.86% | -569.65% |
| Operating Income | -15.58M | -1.84M | -1.96M |
| Operating Income Ratio | -1,390.01% | -306.45% | -622.51% |
| Total Other Income/Expenses | -171.00K | 0.00 | 0.00 |
| Income Before Tax | -15.75M | -1.84M | -1.96M |
| Income Before Tax Ratio | -1,405.27% | -306.45% | -622.51% |
| Income Tax Expense | 0.00 | 5.00 | 4.00 |
| Net Income | -15.75M | -1.84M | -1.96M |
| Net Income Ratio | -1,405.27% | -306.45% | -622.51% |
| EPS | -17.01 | -0.17 | -0.18 |
| EPS Diluted | -17.01 | -0.17 | -0.18 |
| Weighted Avg Shares Out | 925.61K | 11.16M | 11.16M |
| Weighted Avg Shares Out (Dil) | 925.61K | 11.16M | 11.16M |

LQR House Inc. Announces Closing of $5,750,000 Initial Public Offering, Including Exercise of Full Over-Allotment Option

LQR Stock Alert: What to Know as LQR House Starts Trading Today
Source: https://incomestatements.info
Category: Stock Reports
