See more : Magenta Therapeutics, Inc. (MGTA) Income Statement Analysis – Financial Results
Complete financial analysis of LATAM Airlines Group S.A. (LTMAY) income statement, including revenue, profit margins, EPS and key performance metrics. Get detailed insights into the financial performance of LATAM Airlines Group S.A., a leading company in the Airlines, Airports & Air Services industry within the Industrials sector.
- Wanderport Corporation (WDRP) Income Statement Analysis – Financial Results
- SAI.TECH Global Corporation (SAITW) Income Statement Analysis – Financial Results
- Naked Wines plc (WINE.L) Income Statement Analysis – Financial Results
- ZW Data Action Technologies Inc. (CNET) Income Statement Analysis – Financial Results
- Diversified Healthcare Trust (DHC) Income Statement Analysis – Financial Results
LATAM Airlines Group S.A. (LTMAY)
Industry: Airlines, Airports & Air Services
Sector: Industrials
Website: https://www.latamairlinesgroup.net
About LATAM Airlines Group S.A.
LATAM Airlines Group S.A., together with its subsidiaries, provides passenger and cargo air transportation services primarily in Chile, Peru, Ecuador, Colombia, Brazil, other Latin American countries, the Caribbean, North America, Europe, and Oceania. As of June 30, 2022, it provided passenger transport services to 133 destinations in 20 countries and cargo services to approximately 141 destinations in 23 countries, with an operating fleet of 300 aircraft and subleased one B767 cargo freighter to a third party. The company was formerly known as LAN Airlines S.A. and changed its name to LATAM Airlines Group S.A. in June 2012. LATAM Airlines Group S.A. was founded in 1929 and is headquartered in Santiago, Chile.
| Metric | 2023 | 2022 | 2021 | 2020 | 2019 | 2018 | 2017 | 2016 | 2015 | 2014 | 2013 | 2012 | 2011 | 2010 | 2009 | 2008 | 2007 | 2006 | 2005 | 2004 | 2003 | 2002 | 2001 | 2000 | 1999 | 1998 | 1997 |
|---|---|---|---|---|---|---|---|---|---|---|---|---|---|---|---|---|---|---|---|---|---|---|---|---|---|---|---|
| Revenue | 11.64B | 9.52B | 4.88B | 4.33B | 10.07B | 9.90B | 9.61B | 8.99B | 9.74B | 12.09B | 13.27B | 9.72B | 5.72B | 4.39B | 3.67B | 4.53B | 3.52B | 3.03B | 2.51B | 2.09B | 1.64B | 1.45B | 1.43B | 1.43B | 1.24B | 1.08B | 969.80M |
| Cost of Revenue | 8.87B | 7.03B | 4.96B | 4.78B | 7.95B | 7.96B | 7.44B | 6.97B | 7.64B | 9.62B | 10.98B | 7.64B | 2.91B | 3.01B | 2.52B | 1.37B | 0.00 | 2.20B | 1.96B | 1.63B | 1.35B | 1.27B | 754.78M | 876.01M | 683.79M | 640.40M | 564.80M |
| Gross Profit | 2.77B | 2.48B | -79.47M | -444.11M | 2.12B | 1.93B | 2.17B | 2.02B | 2.10B | 2.47B | 2.29B | 2.08B | 2.80B | 1.38B | 1.15B | 3.17B | 3.52B | 833.87M | 542.51M | 458.78M | 287.82M | 181.62M | 673.56M | 549.14M | 552.88M | 436.90M | 405.00M |
| Gross Profit Ratio | 23.79% | 26.11% | -1.63% | -10.25% | 21.04% | 19.53% | 22.59% | 22.49% | 21.59% | 20.42% | 17.23% | 21.39% | 49.04% | 31.38% | 31.33% | 69.90% | 100.00% | 27.48% | 21.65% | 21.92% | 17.56% | 12.50% | 47.16% | 38.53% | 44.71% | 40.56% | 41.76% |
| Research & Development | 0.00 | 0.00 | 0.00 | 0.00 | 0.00 | 0.00 | 0.00 | 0.00 | 0.00 | 0.00 | 0.00 | 0.00 | 0.00 | 0.00 | 0.00 | 0.00 | 0.00 | 0.00 | 0.00 | 0.00 | 0.00 | 0.00 | 0.00 | 0.00 | 0.00 | 0.00 | 0.00 |
| General & Administrative | 683.31M | 1.21B | 439.49M | 499.51M | 735.22M | 721.27M | 938.93M | 872.95M | 878.01M | 980.66M | 1.14B | 869.50M | 1.01B | 331.83M | 155.13M | 1.09B | 489.55M | 1.30B | 1.14B | 1.00B | 845.58M | 1.00B | 0.00 | 0.00 | 0.00 | 0.00 | 0.00 |
| Selling & Marketing | 587.27M | 426.60M | 291.82M | 294.28M | 580.05M | 619.20M | 699.60M | 747.43M | 783.30M | 957.07M | 1.03B | 803.62M | 209.26M | 0.00 | 114.46M | 458.26M | 0.00 | -403.90M | -345.39M | -291.69M | -223.97M | -192.69M | 0.00 | 0.00 | 0.00 | 0.00 | 0.00 |
| SG&A | 1.22B | 1.21B | 731.31M | 793.79M | 1.32B | 1.34B | 1.64B | 1.62B | 1.66B | 1.94B | 2.16B | 1.67B | 1.22B | 331.83M | 269.59M | 1.09B | 489.55M | 898.40M | 795.13M | 711.96M | 621.61M | 809.95M | 200.53M | 223.46M | 206.34M | 360.20M | 309.20M |
| Other Expenses | -384.16M | 1.14B | 271.35M | 427.39M | 153.11M | 77.19M | 104.49M | 65.32M | 47.03M | 31.11M | -538.10M | 28.84M | 0.00 | 172.43M | 100.48M | 183.21M | 2.62B | 2.33B | 2.02B | 1.63B | 1.30B | 968.95M | 1.18B | 1.12B | 979.48M | 32.20M | 16.20M |
| Operating Expenses | 1.60B | 2.35B | 1.00B | 1.22B | 1.47B | 1.25B | 1.57B | 1.59B | 1.70B | 1.96B | 1.64B | 1.83B | 2.26B | 504.26M | 370.07M | 1.73B | 3.11B | 3.23B | 2.81B | 2.34B | 1.92B | 1.78B | 1.38B | 1.34B | 1.19B | 392.40M | 325.40M |
| Cost & Expenses | 10.47B | 9.38B | 5.97B | 6.00B | 9.42B | 9.21B | 9.01B | 8.56B | 9.34B | 11.58B | 12.62B | 9.47B | 5.18B | 3.52B | 2.89B | 3.10B | 3.11B | 5.43B | 4.78B | 3.98B | 3.28B | 3.05B | 2.13B | 2.22B | 1.87B | 1.03B | 890.20M |
| Interest Income | 0.00 | 1.05B | 21.11M | 50.40M | 26.28M | 53.25M | 78.70M | 74.95M | 75.08M | 90.50M | 72.83M | 77.49M | 14.45M | 14.95M | 0.00 | 16.21M | 18.04M | 7.90M | 12.43M | 10.83M | 6.28M | 3.76M | 5.48M | 5.26M | 0.00 | 0.00 | 0.00 |
| Interest Expense | 708.37M | 942.40M | 748.02M | 586.98M | 569.44M | 345.99M | 385.07M | 384.98M | 374.37M | 402.54M | 462.52M | 260.23M | 139.08M | 155.28M | 153.11M | 82.69M | 76.22M | 60.74M | 39.19M | 36.46M | 39.35M | 40.76M | 35.46M | 31.67M | 0.00 | 17.00M | 37.50M |
| Depreciation & Amortization | 1.21B | 1.18B | 1.17B | 1.39B | 1.47B | 1.37B | 1.00B | 959.53M | 36.61M | 991.26M | 1.04B | 44.07M | 404.67M | 147.90M | 480.39M | 183.21M | 146.79M | -122.80M | -80.46M | -77.44M | -72.63M | -67.82M | -51.44M | -42.04M | 37.65M | -32.20M | -16.20M |
| EBITDA | 2.37B | 2.54B | -1.13B | -4.52B | 743.93M | 800.73M | 778.01M | 537.20M | 485.15M | 597.97M | 178.64M | 320.14M | 958.85M | 1.03B | 781.16M | 734.42M | 585.56M | -2.31B | -2.25B | -1.85B | -1.59B | -1.54B | -644.21M | -752.52M | -609.59M | 73.00M | 92.80M |
| EBITDA Ratio | 20.40% | 26.74% | -23.15% | -104.25% | 7.39% | 8.09% | 8.09% | 5.98% | 4.98% | 4.94% | 1.35% | 3.29% | 16.77% | 23.39% | 21.26% | 16.20% | 16.61% | -76.02% | -89.76% | -88.39% | -96.92% | -106.21% | -45.10% | -52.80% | -49.29% | 6.78% | 9.57% |
| Operating Income | 1.17B | 1.50B | -3.43B | -1.67B | 753.13M | 758.62M | 706.78M | 493.30M | 448.54M | 541.42M | 643.91M | 276.08M | 539.73M | 873.55M | 300.77M | 536.18K | 413.37M | 302.62M | 141.64M | 172.10M | 111.72M | 62.06M | 50.25M | 83.39M | 50.84M | 105.20M | 109.00M |
| Operating Income Ratio | 10.04% | 15.72% | -70.14% | -38.42% | 7.48% | 7.67% | 7.35% | 5.49% | 4.61% | 4.48% | 4.85% | 2.84% | 9.44% | 19.90% | 8.19% | 0.01% | 11.73% | 9.97% | 5.65% | 8.22% | 6.82% | 4.27% | 3.52% | 5.85% | 4.11% | 9.77% | 11.24% |
| Total Other Income/Expenses | -520.84M | 1.19B | -3.00B | -3.33B | -611.21M | -461.59M | -332.56M | -219.43M | -474.83M | -476.18M | -927.79M | -149.47M | -157.37M | -371.51M | -23.26M | 399.89M | -45.27M | -14.49M | 33.22M | 19.75M | -9.82M | -24.25M | -39.96M | -24.60M | -2.87M | 3.70M | -37.50M |
| Income Before Tax | 596.49M | 1.60B | -4.08B | -5.11B | 141.92M | 297.03M | 374.22M | 273.87M | -357.12M | 65.23M | -283.89M | 126.60M | 382.36M | 502.03M | 277.52M | 400.43M | 368.10M | 288.14M | 174.86M | 191.85M | 101.90M | 37.81M | 10.29M | 58.79M | 47.97M | 108.90M | 71.50M |
| Income Before Tax Ratio | 5.12% | 16.84% | -83.62% | -117.79% | 1.41% | 3.00% | 3.89% | 3.05% | -3.67% | 0.54% | -2.14% | 1.30% | 6.69% | 11.43% | 7.55% | 8.83% | 10.44% | 9.50% | 6.98% | 9.17% | 6.22% | 2.60% | 0.72% | 4.13% | 3.88% | 10.11% | 7.37% |
| Income Tax Expense | 14.94M | 8.91M | 568.94M | -550.19M | -53.70M | 83.78M | 173.50M | 163.20M | -178.38M | 142.19M | -20.07M | 102.21M | 61.79M | 81.11M | 44.49M | 64.69M | 59.78M | 46.84M | 28.26M | 28.29M | 18.34M | 7.01M | -552.00K | 10.41M | 385.00K | 57.20M | 7.40M |
| Net Income | 581.83M | 1.34B | -4.65B | -4.56B | 190.43M | 181.94M | 155.30M | 69.22M | -219.27M | -109.79M | -281.11M | 10.96M | 320.20M | 419.70M | 231.13M | 335.74M | 308.32M | 241.30M | 146.60M | 163.55M | 83.56M | 30.81M | 10.84M | 48.39M | 47.58M | 31.00M | 64.10M |
| Net Income Ratio | 5.00% | 14.07% | -95.27% | -105.10% | 1.89% | 1.84% | 1.62% | 0.77% | -2.25% | -0.91% | -2.12% | 0.11% | 5.60% | 9.56% | 6.29% | 7.40% | 8.75% | 7.95% | 5.85% | 7.81% | 5.10% | 2.12% | 0.76% | 3.40% | 3.85% | 2.88% | 6.61% |
| EPS | 0.00 | 0.01 | -0.42 | -0.42 | 0.02 | 0.02 | 0.01 | 0.01 | -0.02 | -0.01 | -0.03 | 0.00 | 0.05 | 0.07 | 0.04 | 0.05 | 0.05 | 0.04 | 0.03 | 0.03 | 0.01 | 0.01 | 0.00 | 0.01 | 0.01 | 0.01 | 0.01 |
| EPS Diluted | 0.00 | 0.01 | -0.42 | -0.42 | 0.02 | 0.02 | 0.01 | 0.01 | -0.02 | -0.01 | -0.03 | 0.00 | 0.05 | 0.07 | 0.04 | 0.05 | 0.05 | 0.04 | 0.03 | 0.03 | 0.01 | 0.01 | 0.00 | 0.01 | 0.01 | 0.01 | 0.01 |
| Weighted Avg Shares Out | 604.44B | 96.61B | 10.95B | 10.95B | 10.95B | 10.87B | 10.87B | 9.80B | 9.78B | 9.78B | 9.89B | 7.39B | 6.15B | 6.13B | 6.13B | 6.13B | 5.98B | 5.77B | 5.77B | 5.83B | 5.77B | 5.27B | 5.88B | 5.70B | 5.70B | 5.80B | 5.52B |
| Weighted Avg Shares Out (Dil) | 604.44B | 98.53B | 10.95B | 10.95B | 10.95B | 10.87B | 10.87B | 9.80B | 9.78B | 9.78B | 9.89B | 7.39B | 6.15B | 6.15B | 6.13B | 6.13B | 6.13B | 5.77B | 5.77B | 5.83B | 5.77B | 5.27B | 5.88B | 5.70B | 5.70B | 5.80B | 5.52B |
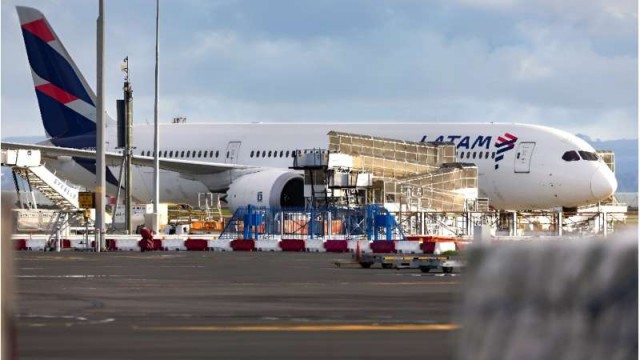
Boeing urges airlines to check switches after LATAM plane plunge
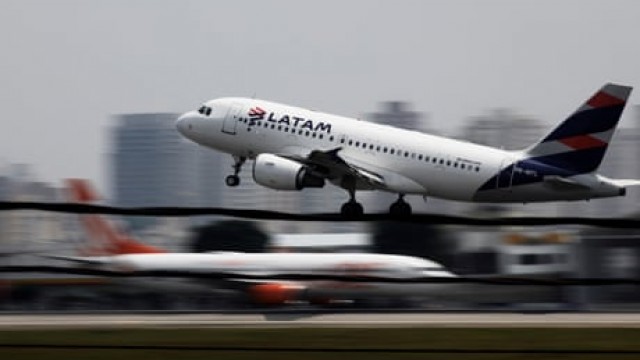
Boeing cockpit seat switch mishap reportedly led to Latam flight incident
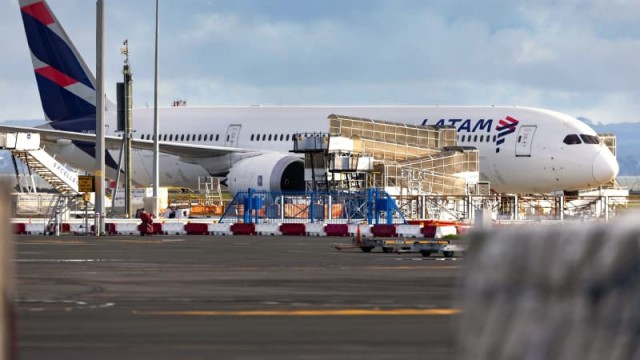
Switch on cockpit pilot seat may have inadvertently triggered sudden plunge in Boeing Latam jet: report

Pilot seat movement a focus of probe into LATAM Boeing flight, report says
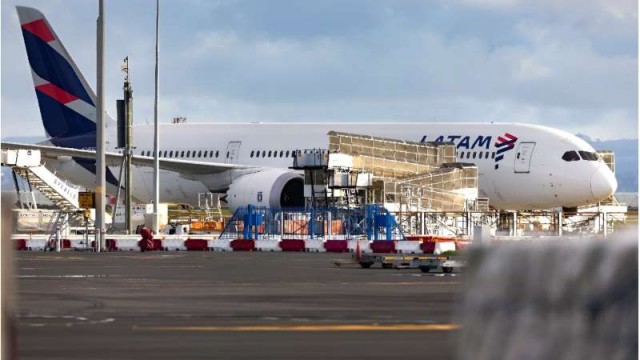
Black box seized after 'technical' failure on Boeing-made LATAM plane
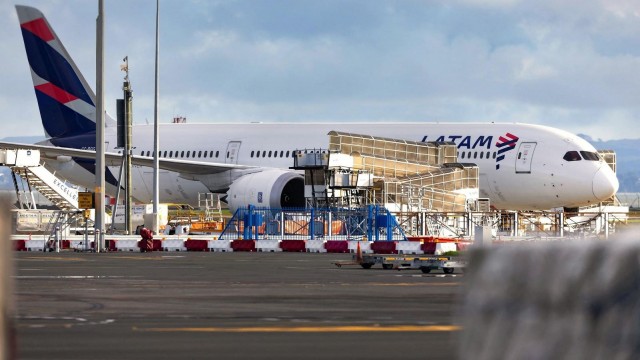
New Zealand Authorities Seize LATAM Boeing 787's Black Boxes After Incident Injures Over 50 Onboard

New Zealand says seizing black boxes from LATAM Boeing 787
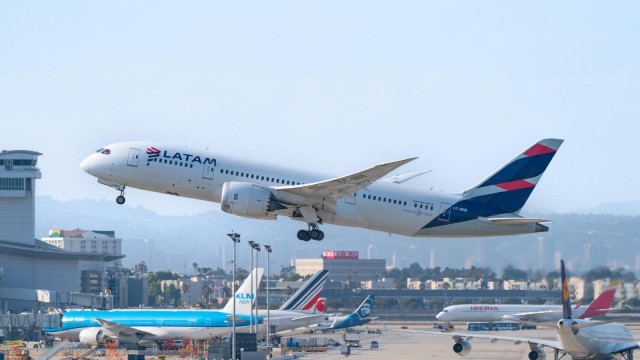
At Least 50 Injured On LATAM Airlines Boeing 787 After Technical Problem Causes Sudden Drop In Altitude
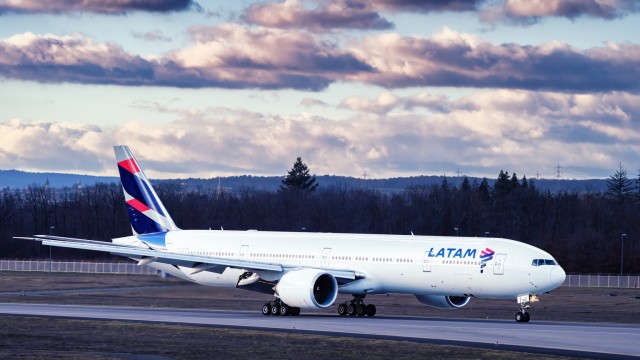
LATAM Airlines Stock: Buy On Revenue And Margin Growth
Source: https://incomestatements.info
Category: Stock Reports
