See more : Washington Federal, Inc. (WAFD) Income Statement Analysis – Financial Results
Complete financial analysis of Lotus Resources Limited (LTSRF) income statement, including revenue, profit margins, EPS and key performance metrics. Get detailed insights into the financial performance of Lotus Resources Limited, a leading company in the Industrial Materials industry within the Basic Materials sector.
- Kissei Pharmaceutical Co., Ltd. (4547.T) Income Statement Analysis – Financial Results
- Beijing Kingsoft Office Software, Inc. (688111.SS) Income Statement Analysis – Financial Results
- Devon Energy Corporation (DVN) Income Statement Analysis – Financial Results
- Churchill Resources Inc. (CRICF) Income Statement Analysis – Financial Results
- CTO Realty Growth, Inc. (CTO-PA) Income Statement Analysis – Financial Results
Lotus Resources Limited (LTSRF)
About Lotus Resources Limited
Lotus Resources Limited explores for, develops, and evaluates mineral properties in Australia and Africa. The company holds an 85% interest in the Kayelekera uranium project located in Malawi, Africa; and the Livingstonia project located in northern Malawi, southern Africa. The company was formerly known as Hylea Metals Limited and changed its name to Lotus Resources Limited in August 2019. Lotus Resources Limited was incorporated in 2006 and is based in Perth, Australia.
| Metric | 2024 | 2023 | 2022 | 2021 | 2020 | 2019 | 2018 | 2017 | 2016 | 2015 | 2014 | 2013 | 2012 | 2011 | 2010 | 2009 |
|---|---|---|---|---|---|---|---|---|---|---|---|---|---|---|---|---|
| Revenue | 21.16K | 102.47K | 2.38M | 127.11K | 109.67K | 37.44K | 190.10K | 28.26K | 20.42K | 30.64K | 72.25K | 217.26K | 0.00 | 0.00 | 0.00 | 117.39K |
| Cost of Revenue | 0.00 | 1.43M | 1.22K | 25.02K | 63.44K | 8.17K | 21.25K | 26.60K | 25.99K | 0.00 | 0.00 | 0.00 | 0.00 | 0.00 | 0.00 | 0.00 |
| Gross Profit | 21.16K | -1.33M | 2.37M | 102.09K | 46.23K | 29.28K | 168.85K | 1.66K | -5.57K | 30.64K | 72.25K | 217.26K | 0.00 | 0.00 | 0.00 | 117.39K |
| Gross Profit Ratio | 100.00% | -1,296.57% | 99.95% | 80.32% | 42.16% | 78.19% | 88.82% | 5.87% | -27.25% | 100.00% | 100.00% | 100.00% | 0.00% | 0.00% | 0.00% | 100.00% |
| Research & Development | 0.00 | 0.00 | 0.00 | 0.00 | 0.00 | 0.00 | 0.00 | 0.00 | 0.00 | 0.00 | 0.00 | 0.00 | 0.00 | 0.00 | 0.00 | 0.00 |
| General & Administrative | 3.61M | 4.64M | 6.41M | 2.96M | 1.25M | 790.89K | 904.61K | 1.10M | 488.10K | 563.59K | 473.37K | 861.95K | 1.05M | 995.60K | 717.19K | 436.61K |
| Selling & Marketing | 9.97M | 4.80M | 0.00 | 0.00 | 0.00 | 0.00 | 0.00 | 0.00 | 0.00 | 0.00 | 0.00 | 0.00 | 0.00 | 0.00 | 0.00 | 0.00 |
| SG&A | 13.57M | 9.44M | 6.41M | 2.96M | 1.25M | 790.89K | 904.61K | 1.10M | 488.10K | 563.59K | 473.37K | 861.95K | 1.05M | 995.60K | 717.19K | 436.61K |
| Other Expenses | 0.00 | 102.47K | 2.54M | 183.06K | 153.72K | 37.44K | 190.10K | 16.42K | 8.12K | 79.00 | 14.99K | 1.05K | 737.75K | -320.68K | 1.10K | 3.22K |
| Operating Expenses | 13.57M | 9.44M | 14.16M | 6.09M | 16.71M | 871.21K | 2.41M | 5.13M | 6.92M | 11.68M | 917.06K | 1.50M | 1.73M | 1.50M | 1.74M | 722.28K |
| Cost & Expenses | 13.57M | 10.87M | 14.16M | 6.09M | 16.71M | 871.21K | 2.41M | 5.13M | 6.92M | 11.68M | 917.06K | 1.50M | 1.73M | 1.50M | 1.74M | 722.28K |
| Interest Income | 1.65M | 1.09M | 37.61K | 4.57K | 6.61K | 4.24K | 25.68K | 11.84K | 12.31K | 30.64K | 57.25K | 217.26K | 562.30K | 249.83K | 187.55K | 0.00 |
| Interest Expense | 0.00 | 1.58M | 137.76K | 0.00 | 19.45K | 0.00 | 0.00 | 0.00 | 0.00 | 0.00 | 0.00 | 0.00 | 0.00 | 0.00 | 0.00 | 0.00 |
| Depreciation & Amortization | 2.74K | 1.43M | 1.22K | 25.02K | 63.44K | 8.17K | 21.25K | 26.60K | 25.99K | 26.00K | 16.00K | 26.43K | 30.54K | 41.19K | 28.24K | 18.45K |
| EBITDA | -13.55M | -8.25M | -11.58M | -5.96M | -16.49M | -817.22K | -2.39M | -5.10M | -6.89M | -11.66M | -901.07K | -1.48M | -1.70M | -1.46M | -1.71M | -586.45K |
| EBITDA Ratio | -64,060.00% | -9,215.12% | -487.48% | -4,767.73% | -15,033.75% | -2,305.15% | -1,255.65% | -18,054.94% | -33,762.03% | -38,045.13% | -1,247.15% | -678.94% | 0.00% | 0.00% | 0.00% | -499.59% |
| Operating Income | -13.55M | -10.87M | -11.58M | -6.09M | -16.55M | -871.21K | -2.41M | -5.13M | -6.92M | -11.68M | -917.06K | -1.50M | -1.73M | -1.50M | -1.74M | -604.90K |
| Operating Income Ratio | -64,060.00% | -10,611.69% | -487.53% | -4,787.41% | -15,091.59% | -2,326.96% | -1,266.82% | -18,149.06% | -33,889.28% | -38,129.97% | -1,269.29% | -691.10% | 0.00% | 0.00% | 0.00% | -515.30% |
| Total Other Income/Expenses | -11.67M | -1.01M | 1.03M | 59.90K | -12.75M | 4.02K | -1.21M | -3.20M | -6.30M | -10.93M | -269.04K | 45.00 | 1.33M | -29.67K | 210.50K | 3.22K |
| Income Before Tax | -25.22M | -10.35M | -12.96M | -5.90M | -16.57M | -821.36K | -2.17M | -5.07M | -6.87M | -11.63M | -828.83K | -1.26M | -396.27K | -1.53M | -1.53M | -601.68K |
| Income Before Tax Ratio | -119,202.40% | -10,099.73% | -545.63% | -4,639.81% | -15,109.32% | -2,193.81% | -1,142.14% | -17,954.94% | -33,662.02% | -37,944.87% | -1,147.16% | -578.46% | 0.00% | 0.00% | 0.00% | -512.56% |
| Income Tax Expense | 22.88K | 211.14K | 1.71M | -887.92K | -474.56K | -12.41K | -46.93K | -38.43K | -38.29K | -56.64K | -73.25K | -243.69K | -592.84K | -291.01K | -209.40K | 0.00 |
| Net Income | -24.51M | -9.92M | -12.00M | -5.01M | -15.92M | -821.36K | -2.17M | -5.07M | -6.87M | -11.63M | -828.83K | -1.26M | -396.27K | -1.53M | -1.53M | -601.68K |
| Net Income Ratio | -115,830.66% | -9,677.51% | -504.94% | -3,944.88% | -14,518.70% | -2,193.81% | -1,142.14% | -17,954.94% | -33,662.02% | -37,944.87% | -1,147.16% | -578.46% | 0.00% | 0.00% | 0.00% | -512.56% |
| EPS | -0.02 | -0.01 | -0.01 | -0.01 | -0.04 | -0.01 | -0.03 | -0.15 | -0.55 | -0.93 | -0.07 | -0.10 | -0.03 | -0.15 | -0.18 | -0.10 |
| EPS Diluted | -0.02 | -0.01 | -0.01 | -0.01 | -0.04 | -0.01 | -0.03 | -0.15 | -0.55 | -0.93 | -0.07 | -0.10 | -0.03 | -0.15 | -0.18 | -0.10 |
| Weighted Avg Shares Out | 1.59B | 1.31B | 1.17B | 820.58M | 361.57M | 129.35M | 73.01M | 33.99M | 12.50M | 12.50M | 12.50M | 12.50M | 12.50M | 9.98M | 8.62M | 5.95M |
| Weighted Avg Shares Out (Dil) | 1.59B | 1.31B | 1.17B | 820.58M | 361.57M | 129.35M | 73.01M | 33.99M | 12.50M | 12.50M | 12.50M | 12.50M | 12.50M | 9.98M | 8.62M | 5.95M |

Lotus Resources begins DFS for Kayelekera Uranium Project following positive technical study results
Lotus Resources' Kaylekera feasibility study will be a critical catalyst for the stock: BW Equities
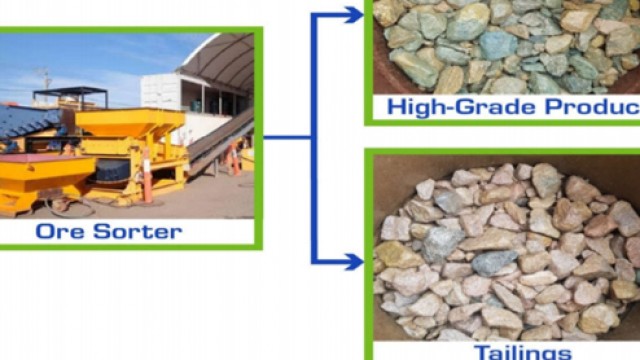
Lotus Resources fields further strong results from ore sorting with potential to enhance Kayelekera Uranium Project
Lotus Resources initiated by Red Cloud Securities with buy rating and target price of 22 cents per share

Lotus Resources gets valuation uplift from BW Equities; management confident on 3 million pounds of uranium production per annum
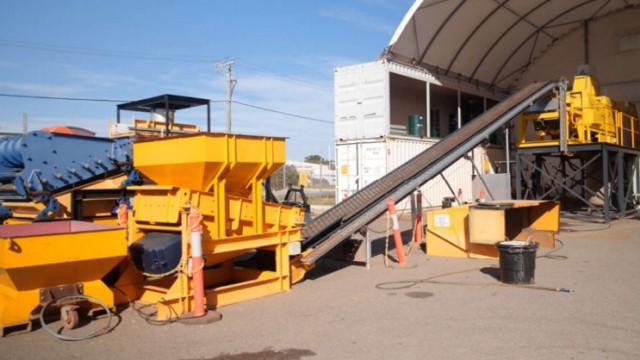
Lotus Resources' ore sorting tests “exceed expectations” at Kayelkera Uranium Project
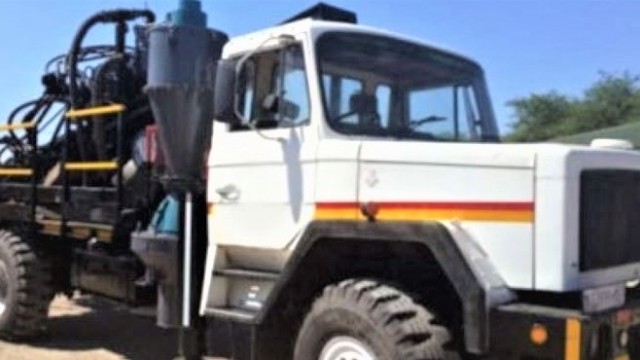
Lotus Resources set to begin exploration drilling at Kayelekera Uranium Project
Lotus Resources fields strong initial results as ore sorting tests begin at Kayelekera Uranium Project

Lotus Resources appoints highly experienced uranium marketing and sales executive

Lotus Resources non-executive director continues to build holding with fourth on-market purchase this week
Source: https://incomestatements.info
Category: Stock Reports
