See more : Winsome Resources Limited (WRSLF) Income Statement Analysis – Financial Results
Complete financial analysis of Lulu’s Fashion Lounge Holdings, Inc. (LVLU) income statement, including revenue, profit margins, EPS and key performance metrics. Get detailed insights into the financial performance of Lulu’s Fashion Lounge Holdings, Inc., a leading company in the Apparel – Retail industry within the Consumer Cyclical sector.
- Trevi Therapeutics, Inc. (TRVI) Income Statement Analysis – Financial Results
- Augwind Energy Tech Storage Ltd (AUGN.TA) Income Statement Analysis – Financial Results
- Phoenix Copper Limited (PXCLY) Income Statement Analysis – Financial Results
- Gyldendal A/S (GYLD-B.CO) Income Statement Analysis – Financial Results
- Novonix Limited (NVX) Income Statement Analysis – Financial Results
Lulu's Fashion Lounge Holdings, Inc. (LVLU)
About Lulu's Fashion Lounge Holdings, Inc.
Lulu's Fashion Lounge Holdings, Inc. operates as an online retailer of women's clothing, shoes, and accessories. The company offers dresses, tops, bottoms, bridal wear, intimates, swimwear, footwear, and accessories under the Lulus brand. It sells its products through owned media, which primarily consists of its website, mobile app, social media platforms, email, and SMS; and earned and paid media, as well as social media platforms. The company primarily serves Millennial and Gen Z women. Lulu's Fashion Lounge Holdings, Inc. was founded in 1996 and is headquartered in Chico, California.
| Metric | 2023 | 2022 | 2021 | 2020 | 2019 | 2018 | 2017 |
|---|---|---|---|---|---|---|---|
| Revenue | 355.18M | 439.65M | 375.63M | 248.66M | 369.62M | 297.11M | 232.47M |
| Cost of Revenue | 206.95M | 248.21M | 198.89M | 138.36M | 208.42M | 164.81M | 122.23M |
| Gross Profit | 148.23M | 191.45M | 176.73M | 110.29M | 161.20M | 132.30M | 110.24M |
| Gross Profit Ratio | 41.73% | 43.54% | 47.05% | 44.36% | 43.61% | 44.53% | 47.42% |
| Research & Development | 0.00 | 0.00 | 0.00 | 0.00 | 0.00 | 0.00 | 0.00 |
| General & Administrative | 92.13M | 99.15M | 87.71M | 67.16M | 73.39M | 55.15M | 42.74M |
| Selling & Marketing | 76.31M | 83.56M | 66.68M | 47.81M | 72.88M | 56.64M | 32.91M |
| SG&A | 168.44M | 182.71M | 154.39M | 114.97M | 146.26M | 113.67M | 76.37M |
| Other Expenses | 0.00 | 136.00K | 85.00K | 137.00K | 239.00K | 0.00 | 0.00 |
| Operating Expenses | 168.44M | 182.71M | 154.39M | 114.97M | 146.26M | 113.25M | 77.50M |
| Cost & Expenses | 375.39M | 430.91M | 353.29M | 253.33M | 354.68M | 278.07M | 199.74M |
| Interest Income | 0.00 | 1.10M | 12.77M | 16.04M | 15.21M | 13.70M | 9.29M |
| Interest Expense | 1.73M | 1.10M | 12.77M | 16.04M | 15.21M | 0.00 | 0.00 |
| Depreciation & Amortization | 4.82M | 7.39M | 2.90M | 3.22M | 3.04M | 2.56M | 1.68M |
| EBITDA | -14.46M | 16.27M | 23.93M | -1.32M | 18.22M | 21.19M | 35.55M |
| EBITDA Ratio | -4.07% | 2.96% | 6.72% | -0.53% | 4.93% | 7.13% | 15.29% |
| Operating Income | -20.22M | 8.74M | 22.34M | -4.68M | 14.94M | 18.63M | 33.87M |
| Operating Income Ratio | -5.69% | 1.99% | 5.95% | -1.88% | 4.04% | 6.27% | 14.57% |
| Total Other Income/Expenses | -795.00K | -967.00K | -14.08M | -15.90M | -14.97M | -13.28M | -10.43M |
| Income Before Tax | -21.01M | 7.77M | 8.26M | -20.58M | -24.00K | 5.35M | 23.44M |
| Income Before Tax Ratio | -5.92% | 1.77% | 2.20% | -8.27% | -0.01% | 1.80% | 10.08% |
| Income Tax Expense | -1.68M | 4.05M | 6.21M | -1.27M | 445.00K | 4.22M | 8.53M |
| Net Income | -19.33M | 3.73M | 2.05M | -19.30M | -469.00K | 1.00M | 14.91M |
| Net Income Ratio | -5.44% | 0.85% | 0.54% | -7.76% | -0.13% | 0.34% | 6.41% |
| EPS | -0.48 | 0.10 | -3.20 | -0.49 | -0.01 | 0.05 | 0.72 |
| EPS Diluted | -0.48 | 0.10 | -3.20 | -0.49 | -0.01 | 0.05 | 0.72 |
| Weighted Avg Shares Out | 39.88M | 38.58M | 38.42M | 39.29M | 39.29M | 20.04M | 20.71M |
| Weighted Avg Shares Out (Dil) | 39.88M | 38.85M | 38.42M | 39.29M | 39.29M | 18.33M | 20.59M |

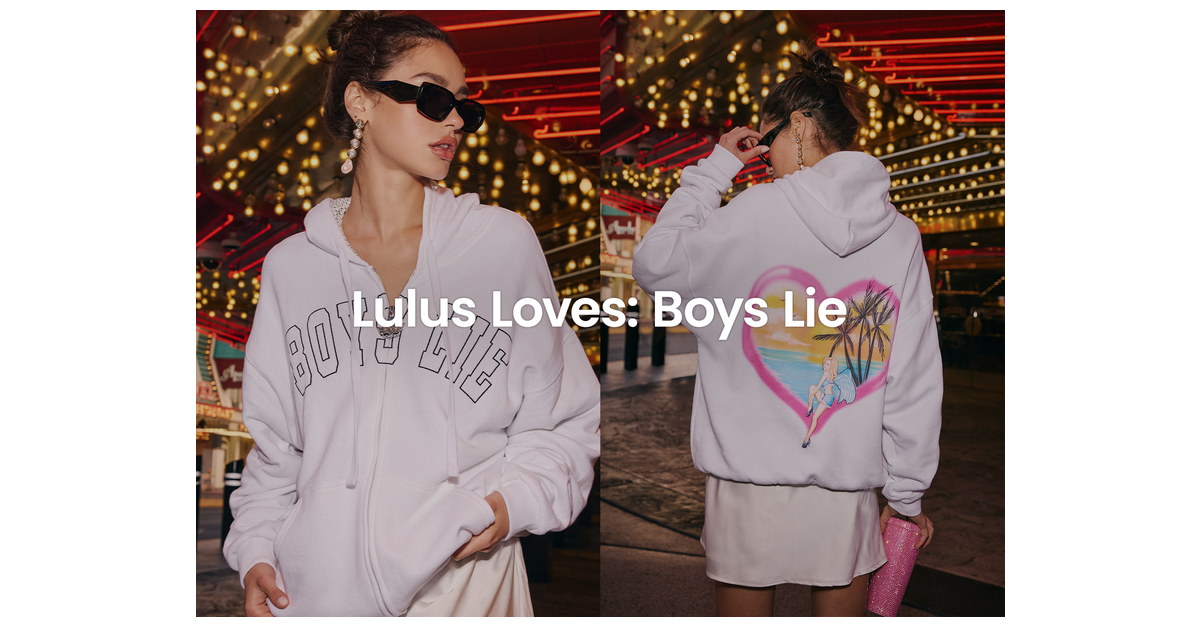
Lulus Announces New Capsule With Boys Lie, Bringing the Brand to Lulus Shoppers for First Time
Lulus Teams With Levi's® to Bring Even More Iconic Styles to Shoppers Everywhere in Lulus Loves: Levi's® Capsule

Lulu's Fashion Lounge Holdings, Inc. (LVLU) Q1 202 four Earnings Call Transcript

Lulu's Fashion Lounge Holdings, Inc. (LVLU) Reports Q1 Loss, Lags Revenue Estimates

Lulus Announces Stock Repurchase Program

Lulus Celebrates Female Friendship With the Launch of First-Ever Out-of-Home Campaign in Major Cities Across the U.S.

Lulus to Report First Quarter 2024 Results on May 8, 2024

Lulu's Fashion Lounge Holdings, Inc. (LVLU) Q4 2023 Earnings Call Transcript

Lulu's Fashion Lounge Holdings, Inc. (LVLU) Reports Q4 Loss, Tops Revenue Estimates

Lulus Reports Fourth Quarter and Fiscal Year 2023 Results
Source: https://incomestatements.info
Category: Stock Reports
