See more : Takamatsu Construction Group Co., Ltd. (1762.T) Income Statement Analysis – Financial Results
Complete financial analysis of Lynas Rare Earths Limited (LYSCF) income statement, including revenue, profit margins, EPS and key performance metrics. Get detailed insights into the financial performance of Lynas Rare Earths Limited, a leading company in the Industrial Materials industry within the Basic Materials sector.
- Evolution Mining Limited (EVN.AX) Income Statement Analysis – Financial Results
- L.P.N. Development Public Company Limited (LPN.BK) Income Statement Analysis – Financial Results
- Formulafirst Limited (FFI.SW) Income Statement Analysis – Financial Results
- Nanjing Central Emporium (Group) Stocks Co., Ltd. (600280.SS) Income Statement Analysis – Financial Results
- CBM Bancorp, Inc. (CBMB) Income Statement Analysis – Financial Results
Lynas Rare Earths Limited (LYSCF)
About Lynas Rare Earths Limited
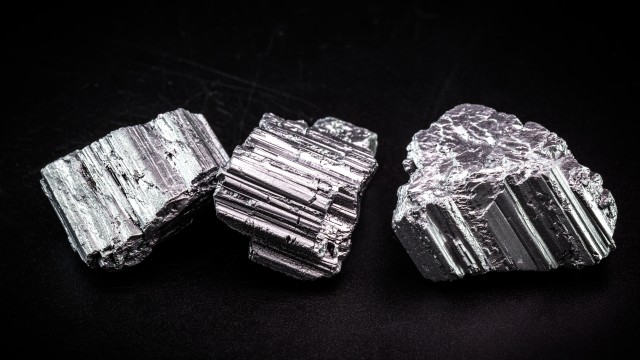
Lynas Rare Earths Limited, together with its subsidiaries, engages in the exploration, development, mining, extraction, and processing of rare earth minerals primarily in Australia and Malaysia. The company holds an interest in the Mount Weld project, Western Australia. Its products include neodymium and praseodymium, lanthanum, cerium, and mixed heavy rare earth materials. The company also develops and operates advanced material processing and concentration plants. In addition, it offers corporate services. The company was formerly known as Lynas Corporation Limited and changed its name to Lynas Corporation Limited in November 2020. Lynas Rare Earths Limited was founded in 1983 and is headquartered in East Perth, Australia.
| Metric | 2024 | 2023 | 2022 | 2021 | 2020 | 2019 | 2018 | 2017 | 2016 | 2015 | 2014 | 2013 |
|---|---|---|---|---|---|---|---|---|---|---|---|---|
| Revenue | 464.45M | 739.28M | 920.01M | 489.02M | 305.11M | 363.54M | 374.11M | 256.98M | 190.96M | 144.60M | 64.57M | 950.00K |
| Cost of Revenue | 279.99M | 413.68M | 356.48M | 309.54M | 275.01M | 278.86M | 260.74M | 247.34M | 224.31M | 168.35M | 77.68M | 1.48M |
| Gross Profit | 184.46M | 325.60M | 563.54M | 179.48M | 30.10M | 84.68M | 113.37M | 9.64M | -33.35M | -23.75M | -13.11M | -530.00K |
| Gross Profit Ratio | 39.72% | 44.04% | 61.25% | 36.70% | 9.87% | 23.29% | 30.30% | 3.75% | -17.46% | -16.42% | -20.30% | -55.79% |
| Research & Development | 0.00 | 0.00 | 0.00 | 0.00 | 0.00 | 0.00 | 0.00 | 0.00 | 0.00 | 0.00 | 0.00 | 0.00 |
| General & Administrative | 36.84M | 45.78M | 38.86M | 24.19M | 43.50M | 33.61M | 34.27M | 25.50M | 34.79M | 40.92M | 19.15M | 67.56M |
| Selling & Marketing | 18.30M | 0.00 | -1.00K | 0.00 | 0.00 | -4.90M | -6.94M | -4.22M | -12.00M | 0.00 | 95.21M | 41.10M |
| SG&A | 55.14M | 45.78M | 38.86M | 24.19M | 43.50M | 28.71M | 27.33M | 21.28M | 22.79M | 40.92M | 114.36M | 108.66M |
| Other Expenses | 129.31M | -17.48M | 38.79M | -7.11M | -4.88M | 0.00 | 0.00 | 0.00 | -1.47M | 0.00 | 0.00 | 0.00 |
| Operating Expenses | 184.46M | 45.78M | 38.86M | 24.19M | 43.50M | 28.71M | 27.33M | 21.28M | 24.26M | 56.43M | 308.39M | 131.09M |
| Cost & Expenses | 388.05M | 459.46M | 395.33M | 333.74M | 318.51M | 307.57M | 288.06M | 268.62M | 248.56M | 224.78M | 386.07M | 132.57M |
| Interest Income | 39.85M | 36.36M | 4.64M | 2.93M | 2.66M | 2.31M | 1.18M | 233.00K | 196.00K | 38.38M | 23.94M | 9.40M |
| Interest Expense | 8.77M | 1.28M | 7.46M | 11.67M | 15.22M | 18.31M | 26.79M | 37.52M | 37.50M | 37.79M | 29.38M | 22.00M |
| Depreciation & Amortization | 56.90M | 67.50M | 64.58M | 70.12M | 74.36M | 43.76M | 41.65M | 44.81M | 42.72M | 11.99M | 22.25M | 16.33M |
| EBITDA | 171.17M | 347.32M | 589.26M | 225.41M | 62.20M | 99.73M | 127.70M | 33.17M | -14.70M | -52.54M | -96.47M | -99.00M |
| EBITDA Ratio | 36.85% | 46.98% | 64.05% | 46.09% | 19.98% | 27.43% | 34.13% | 12.91% | -7.80% | -36.34% | -149.40% | -10,421.26% |
| Operating Income | 72.42M | 279.82M | 524.68M | 155.29M | -13.40M | 55.97M | 86.04M | -11.64M | -57.61M | -64.54M | -118.71M | -115.33M |
| Operating Income Ratio | 15.59% | 37.85% | 57.03% | 31.75% | -4.39% | 15.40% | 23.00% | -4.53% | -30.17% | -44.63% | -183.85% | -12,139.89% |
| Total Other Income/Expenses | 33.09M | 14.85M | -4.88M | -12.01M | -12.91M | 26.40M | -32.64M | -9.76M | -38.22M | -37.28M | -27.41M | -25.69M |
| Income Before Tax | 105.50M | 347.84M | 535.76M | 157.49M | -19.16M | 83.27M | 53.40M | -24.26M | -94.12M | -118.56M | -345.43M | -141.01M |
| Income Before Tax Ratio | 22.72% | 47.05% | 58.23% | 32.20% | -6.28% | 22.91% | 14.28% | -9.44% | -49.29% | -81.99% | -534.97% | -14,843.58% |
| Income Tax Expense | 20.99M | 37.17M | -5.07M | 404.00K | 239.00K | 195.00K | 285.00K | -23.73M | -35.00K | 126.00K | 57.00K | 2.54M |
| Net Income | 84.51M | 310.67M | 540.82M | 157.08M | -19.40M | 83.08M | 53.12M | -534.00K | -94.08M | -118.69M | -345.49M | -143.56M |
| Net Income Ratio | 18.20% | 42.02% | 58.78% | 32.12% | -6.36% | 22.85% | 14.20% | -0.21% | -49.27% | -82.08% | -535.06% | -15,111.05% |
| EPS | 0.09 | 0.34 | 0.60 | 0.18 | -0.03 | 0.12 | 0.09 | 0.00 | -0.27 | -0.38 | -1.73 | -0.51 |
| EPS Diluted | 0.09 | 0.34 | 0.60 | 0.18 | -0.03 | 0.12 | 0.08 | 0.00 | -0.27 | -0.38 | -1.73 | -0.51 |
| Weighted Avg Shares Out | 938.01M | 912.35M | 902.17M | 868.75M | 703.69M | 674.00M | 609.00M | 356.71M | 353.01M | 310.67M | 199.27M | 279.83M |
| Weighted Avg Shares Out (Dil) | 937.99M | 915.85M | 905.90M | 873.20M | 703.69M | 719.27M | 664.63M | 356.71M | 353.01M | 310.67M | 199.27M | 279.99M |

Lynas Rare Earths Limited (LYSCF) Q1 2025 Earnings Call Transcript

Lynas Rare Earths Limited (LYSCF) Q4 2024 Earnings Call Transcript

Lynas Rare Earths Limited (LYSCF) Q2 2024 Earnings Call Transcript

Lynas Rare Earths Limited (LYSCF) Q2 2024 Earnings Call Transcript

Lynas Rare Earths: Leading Pure Play Rare Earths Company With Growth

Lynas trades up on Malaysian license extension

Lynas reports decline in quarterly revenue due to lower rare earth prices

Lynas Rare Earths Limited (LYSCF) Q1 2024 Earnings Call Transcript

Lynas Rare Earths Limited (LYSCF) Q4 2023 Earnings Call Transcript

Lynas Rare Earths Limited (LYSCF) Q4 2023 Earnings Call Transcript
Source: https://incomestatements.info
Category: Stock Reports
