See more : Oiles Corporation (6282.T) Income Statement Analysis – Financial Results
Complete financial analysis of Merrimack Pharmaceuticals, Inc. (MACK) income statement, including revenue, profit margins, EPS and key performance metrics. Get detailed insights into the financial performance of Merrimack Pharmaceuticals, Inc., a leading company in the Biotechnology industry within the Healthcare sector.
- Macauto Industrial Co., Ltd. (9951.TWO) Income Statement Analysis – Financial Results
- Signal Hill Acquisition Corp. (SGHL) Income Statement Analysis – Financial Results
- Cornerstone Community Bancorp (CRSB) Income Statement Analysis – Financial Results
- EDP Corporation (7794.T) Income Statement Analysis – Financial Results
- NCR Corporation (NCR) Income Statement Analysis – Financial Results
Merrimack Pharmaceuticals, Inc. (MACK)
About Merrimack Pharmaceuticals, Inc.
Merrimack Pharmaceuticals, Inc. operates as a biopharmaceutical company. The company was incorporated in 1993 and is headquartered in Cambridge, Massachusetts.
| Metric | 2023 | 2022 | 2021 | 2020 | 2019 | 2018 | 2017 | 2016 | 2015 | 2014 | 2013 | 2012 | 2011 | 2010 | 2009 |
|---|---|---|---|---|---|---|---|---|---|---|---|---|---|---|---|
| Revenue | 0.00 | 0.00 | 0.00 | 0.00 | 0.00 | 0.00 | 0.00 | 144.27M | 89.26M | 102.76M | 47.79M | 48.92M | 34.22M | 20.31M | 2.15M |
| Cost of Revenue | 0.00 | 445.00K | 0.00 | 0.00 | 2.23M | 0.00 | 0.00 | 6.91M | 46.00K | 0.00 | 0.00 | 0.00 | 100.63M | 58.28M | 37.66M |
| Gross Profit | 0.00 | -445.00K | 0.00 | 0.00 | -2.23M | 0.00 | 0.00 | 137.36M | 89.21M | 102.76M | 47.79M | 48.92M | -66.42M | -37.97M | -35.51M |
| Gross Profit Ratio | 0.00% | 0.00% | 0.00% | 0.00% | 0.00% | 0.00% | 0.00% | 95.21% | 99.95% | 100.00% | 100.00% | 100.00% | -194.11% | -187.01% | -1,653.17% |
| Research & Development | 0.00 | 0.00 | 0.00 | 0.00 | 11.10M | 49.97M | 67.31M | 160.92M | 160.99M | 138.50M | 147.14M | 125.86M | 365.00K | 0.00 | 0.00 |
| General & Administrative | 2.18M | 2.17M | 2.62M | 5.01M | 16.17M | 15.60M | 28.45M | 0.00 | 0.00 | 30.52M | 21.19M | 15.81M | 8.84M | 0.00 | 0.00 |
| Selling & Marketing | 2.17M | 0.00 | 0.00 | 0.00 | 0.00 | 0.00 | 0.00 | 0.00 | 0.00 | 0.00 | 0.00 | 0.00 | 5.62M | 0.00 | 0.00 |
| SG&A | 2.18M | 2.17M | 2.62M | 5.01M | 16.17M | 15.60M | 28.45M | 80.73M | 57.60M | 30.52M | 21.19M | 15.81M | 14.45M | 11.38M | 12.18M |
| Other Expenses | 0.00 | 0.00 | 0.00 | -191.00K | 370.00K | -3.23M | -1.43M | -43.38M | -18.22M | -17.30M | -10.15M | 988.00K | 34.16M | 0.00 | 0.00 |
| Operating Expenses | 2.18M | 2.17M | 2.62M | 5.01M | 27.27M | 65.58M | 95.77M | 241.65M | 218.58M | 169.01M | 168.33M | 141.66M | 14.45M | 11.38M | 12.18M |
| Cost & Expenses | 2.18M | 2.17M | 2.62M | 5.01M | 27.27M | 65.58M | 95.77M | 248.56M | 218.63M | 169.01M | 168.33M | 141.66M | 115.08M | 69.66M | 49.84M |
| Interest Income | 868.00K | 188.00K | 20.00K | 50.00K | 777.00K | 1.30M | 895.00K | 276.00K | 99.00K | 114.00K | 166.00K | 184.00K | 56.00K | 74.00K | 81.00K |
| Interest Expense | 0.00 | 0.00 | 0.00 | 0.00 | 1.53M | 956.00K | 34.65M | 43.65M | 19.23M | 18.23M | 10.94M | 553.00K | 13.00K | 3.73M | 4.91M |
| Depreciation & Amortization | 167.90K | -890.00K | -288.00K | -2.28M | -1.54M | 4.07M | 5.22M | 6.25M | 4.29M | 3.22M | 2.59M | 3.66M | 5.33M | 4.38M | 2.76M |
| EBITDA | -2.18M | -2.62M | -2.76M | -5.15M | -20.26M | -65.58M | -91.08M | -110.14M | -125.28M | -66.26M | -120.54M | -92.74M | -75.49M | -44.90M | -44.85M |
| EBITDA Ratio | 0.00% | 0.00% | 0.00% | 0.00% | 0.00% | 0.00% | 0.00% | -68.22% | -144.94% | -64.48% | -252.25% | -189.58% | -220.63% | -221.13% | -2,088.08% |
| Operating Income | -2.18M | -1.73M | -2.47M | -2.87M | -22.36M | -65.58M | -95.77M | -110.14M | -129.57M | -66.26M | -120.54M | -92.74M | -80.87M | -49.18M | -47.69M |
| Operating Income Ratio | 0.00% | 0.00% | 0.00% | 0.00% | 0.00% | 0.00% | 0.00% | -76.34% | -145.16% | -64.48% | -252.25% | -189.58% | -236.36% | -242.19% | -2,220.11% |
| Total Other Income/Expenses | 1.01M | 188.00K | 20.00K | -141.00K | -381.00K | -2.89M | -22.64M | -43.38M | -18.22M | -17.30M | -10.15M | 1.47M | 1.19M | -983.00K | -4.79M |
| Income Before Tax | -1.17M | -1.54M | -2.45M | -3.01M | -22.74M | -68.46M | -118.40M | -153.52M | -147.79M | -83.56M | -130.69M | -91.75M | -79.68M | -50.16M | -52.48M |
| Income Before Tax Ratio | 0.00% | 0.00% | 0.00% | 0.00% | 0.00% | 0.00% | 0.00% | -106.41% | -165.57% | -81.32% | -273.48% | -187.56% | -232.87% | -247.03% | -2,442.97% |
| Income Tax Expense | 12.00K | 3.00K | 3.00K | 14.00K | -1.47M | -7.70M | -42.40M | -13.22M | -3.92M | -3.49M | -2.35M | -4.14M | -440.00K | 3.67M | -3.40M |
| Net Income | -1.18M | -1.54M | -2.46M | -3.03M | -21.27M | -40.51M | 472.03M | -151.74M | -147.96M | -83.29M | -130.93M | -91.28M | -79.22M | -50.10M | -49.07M |
| Net Income Ratio | 0.00% | 0.00% | 0.00% | 0.00% | 0.00% | 0.00% | 0.00% | -105.18% | -165.76% | -81.06% | -273.98% | -186.58% | -231.54% | -246.76% | -2,284.59% |
| EPS | -0.08 | -0.11 | -0.18 | -0.23 | -1.59 | -3.04 | 35.67 | -12.11 | -13.29 | -7.98 | -13.24 | -12.53 | -8.57 | -44.17 | -43.26 |
| EPS Diluted | -0.08 | -0.11 | -0.18 | -0.23 | -1.59 | -3.04 | 35.67 | -12.11 | -13.29 | -7.98 | -13.24 | -12.53 | -8.57 | -44.17 | -43.26 |
| Weighted Avg Shares Out | 14.30M | 13.52M | 13.41M | 13.38M | 13.35M | 13.34M | 13.23M | 12.53M | 11.14M | 10.44M | 9.89M | 7.28M | 9.24M | 1.13M | 1.13M |
| Weighted Avg Shares Out (Dil) | 14.30M | 13.52M | 13.41M | 13.38M | 13.35M | 13.34M | 13.23M | 12.53M | 11.14M | 10.44M | 9.89M | 7.28M | 9.24M | 1.13M | 1.13M |

Merrimack stock rockets 200% after positive trial data on Onivyde pancreatic cancer treatment

Return Of The Mack: A Deeply Misunderstood Near-Term Readout

Merrimack Reports Second Quarter 2021 Financial Results

Merrimack Reports Full Year 2020 Financial Results
Merrimack Reports Second Quarter 2020 Financial Results

Merrimack Pharmaceuticals Inc (NASDAQ:MACK) Insider Sells $363,326.04 in Stock
Merrimack Reports First Quarter 2020 Financial Results
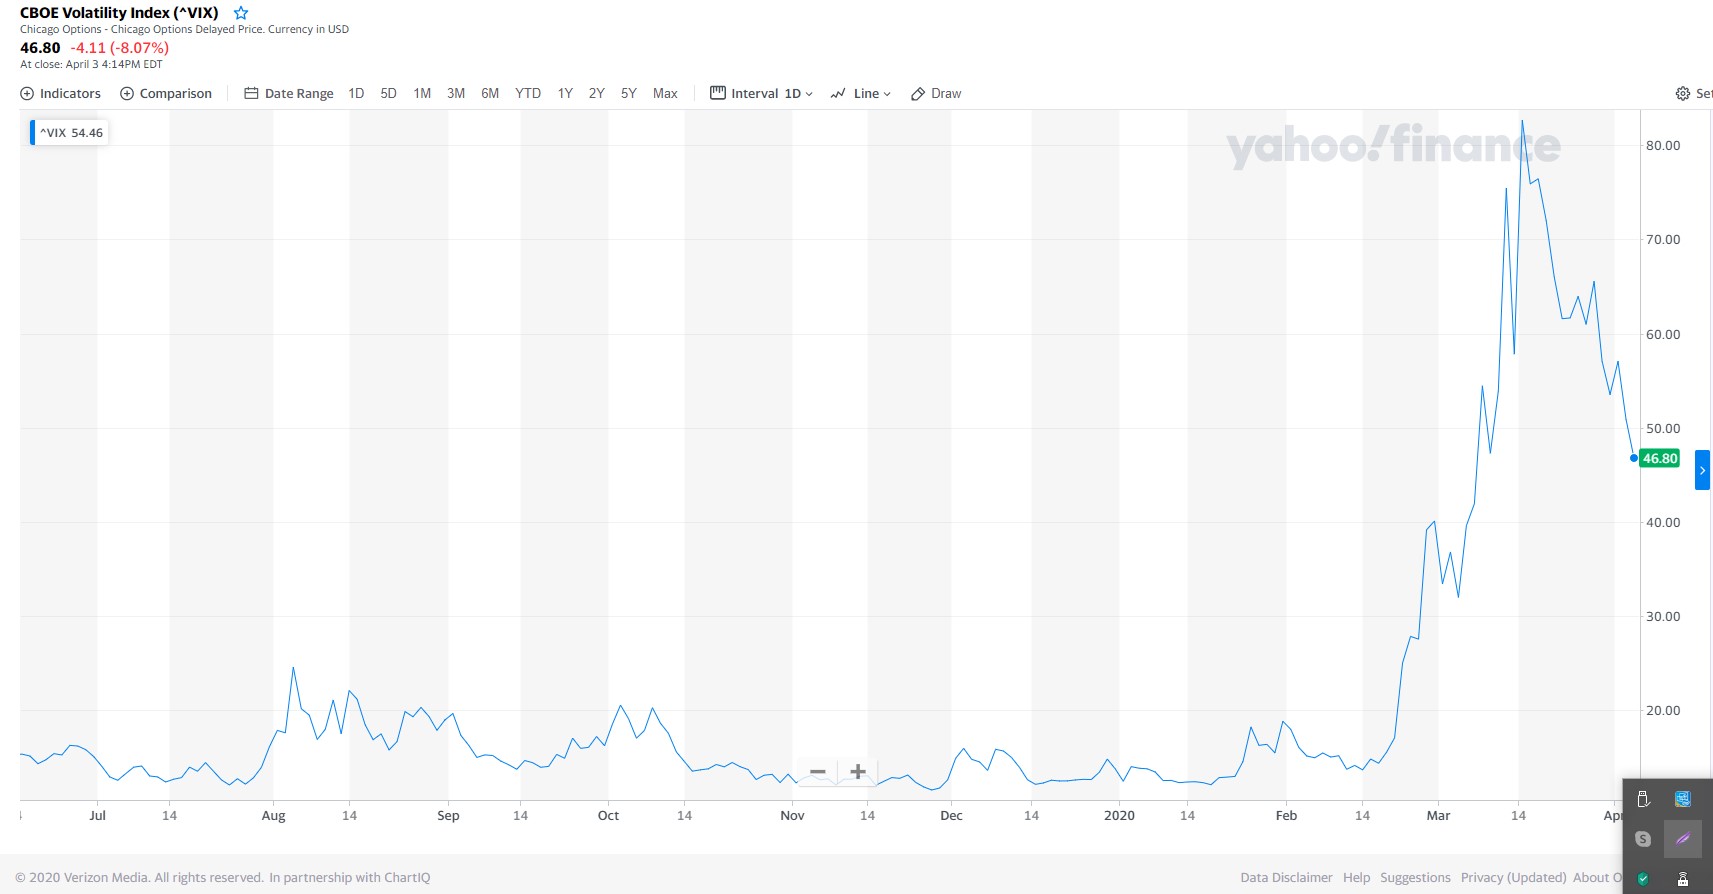
US Stock Market Weekly Update March 30- April 3, 2020
The Daily Biotech Pulse: Milestone Pharma Flunks Late-Stage Study, CytomX Strikes Cancer Drug Collaboration, BARDA Grant For GenMark's COVID-19 Test
The Daily Biotech Pulse: Mylan Ramps Up Manufacturing Of Potential COVID-19 Drug, Lexicon Stops Study Early, Masimo To Buy German Ventilation Company
Source: https://incomestatements.info
Category: Stock Reports
